

Copper: The Supply Inelasticity Trap
The world needs more copper, but the system can’t produce it fast enough

TL;DR:
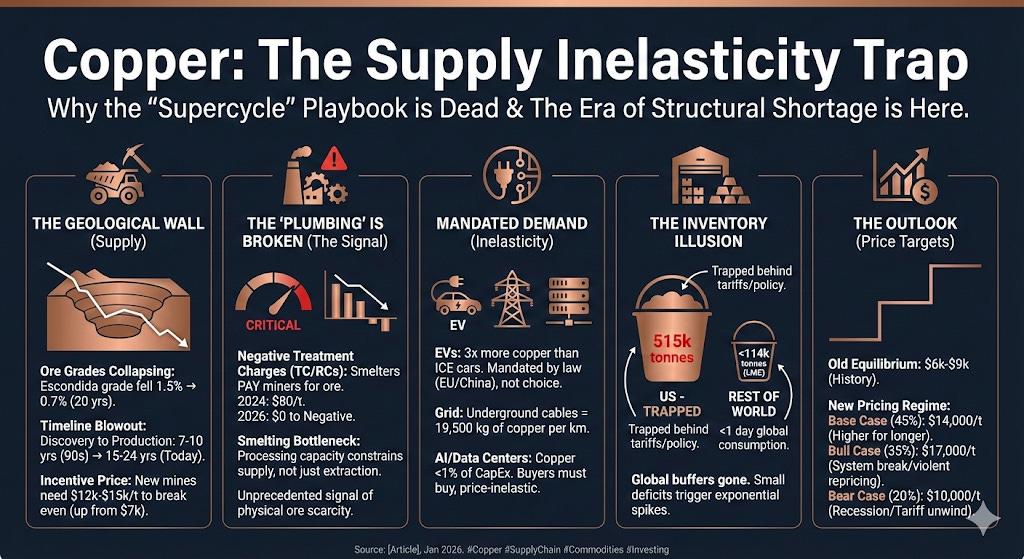
Ore grades are falling and new mine timelines are now measured in decades, not cycles.
Miners are choosing buybacks over mega-projects, and politics/ESG keeps supply stuck.
Tight inventories + negative treatment charges signal a structural shortage, not a temporary spike.
The Last Time This Worked
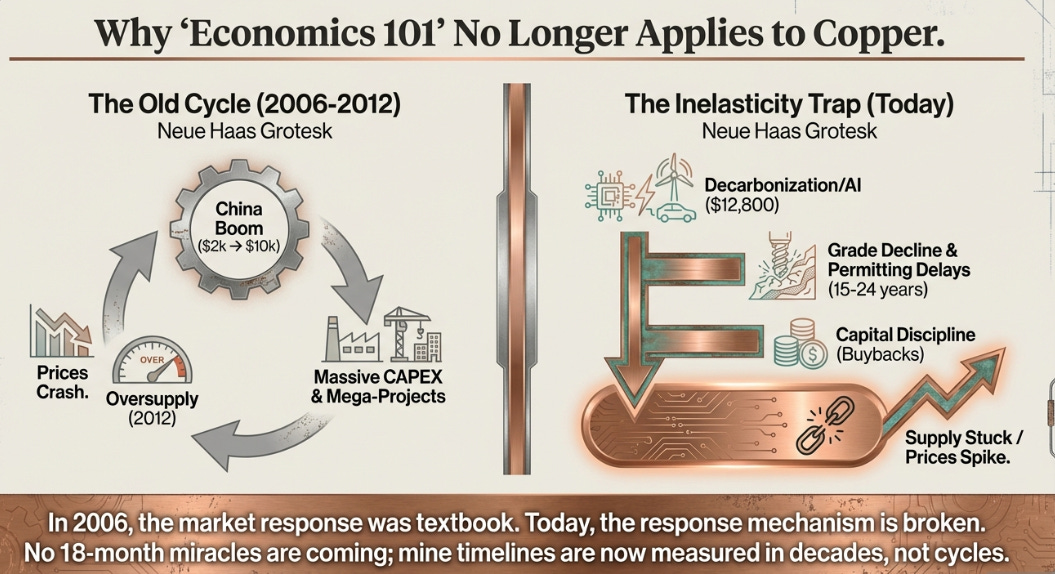
In 2006, copper was simple. China was building the equivalent of a new Europe in a decade, and every apartment tower, subway line, and power plant needed copper wire. Prices rocketed from $2,000 per tonne to over $10,000. The market’s response was textbook: mining companies, flush with cash and emboldened by “supercycle” confidence, sanctioned a massive wave of new mega-projects across Chile, Peru, and the Congo.
By 2012, that new supply began hitting the market. The result was exactly what Economics 101 promised: a decade of oversupply, crashing prices, and brutal losses for anyone who invested at the peak. The lesson was seared into every commodity trader’s brain: high prices cure high prices.
That playbook is dead.
Three Immovable Constraints
Before examining what’s happening in copper markets today, it’s worth stating explicitly what this thesis requires to be true. If any one of these three constraints softens, the entire framework collapses:
No 18-month miracles. No technology or regulatory breakthrough can meaningfully increase mine supply before 2028. This means no AI-driven exploration bonanza, no emergency permitting waivers, no political shifts in mining jurisdictions that suddenly accelerate projects. The 15-24 year average development timeline from discovery to production is a constant, not a variable that responds to price signals.
This assumption would break if: The U.S. invokes Defense Production Act to fast-track Resolution Copper, cutting permitting from 20+ years to 3-4 years. Or if a major jurisdiction (Chile, Peru, Indonesia) reverses resource nationalism policies and offers expedited approvals for stalled projects. Or if someone develops economically viable seabed mining that can scale to 500,000+ tonnes annually within 36 months.
China doesn’t collapse. Demand growth can slow to 0-1% annually, but a sustained decline exceeding 5% for two consecutive quarters would invalidate the deficit thesis. At that point, the property sector drag (30% of China’s copper demand, declining 15-20% annually) would be larger than EV and grid growth (20% of demand, growing 8-10%) can offset. China represents 58% of global consumption, if that’s shrinking faster than the rest of the world is growing, there’s no deficit.
This assumption would break if: China’s property crisis deepens into a Japan-style multi-decade deflation. Or if EV subsidies are cut and adoption stalls at 60% market share rather than reaching 80%+. Or if grid investment gets slashed due to fiscal constraints.
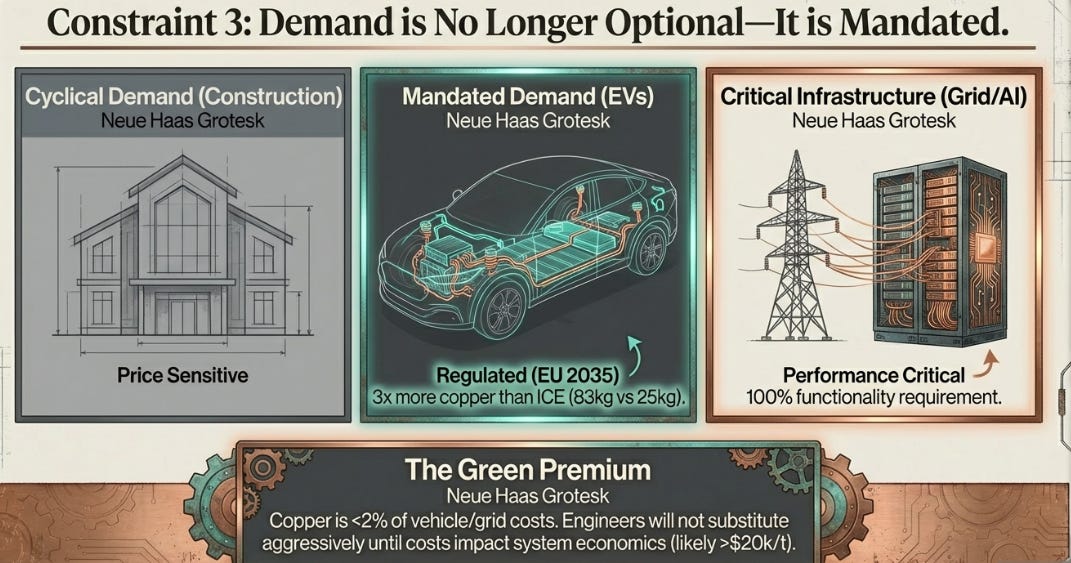
Copper stays cheap relative to alternatives. In EVs, copper represents roughly 2% of vehicle cost. In data centers, it’s less than 1% of capital expenditure. In grid projects, it’s under 2% of total infrastructure spend. As long as copper remains a rounding error in system economics, engineers won’t get a mandate to substitute aggressively. The threshold where redesigns become urgent is probably 5-8% of system cost.
This assumption would break if: Copper sustains above $20,000 per tonne for 12+ months, forcing wholesale redesigns across all applications. Or if aluminum prices collapse below $2,000 per tonne (currently $2,600), making the copper-to-aluminum ratio exceed 8-10x and triggering emergency substitution programs.
These three constraints, geological/political inertia, Chinese demand stability, and cost-share thresholds, form the foundation. What follows is the evidence that they’re holding, and what that means for price.
The Geological Wall
Today, copper sits at $12,800 per tonne, near record highs, and the supply response isn’t coming. Despite the clearest possible price signal, the wave of new mine development remains conspicuously absent.
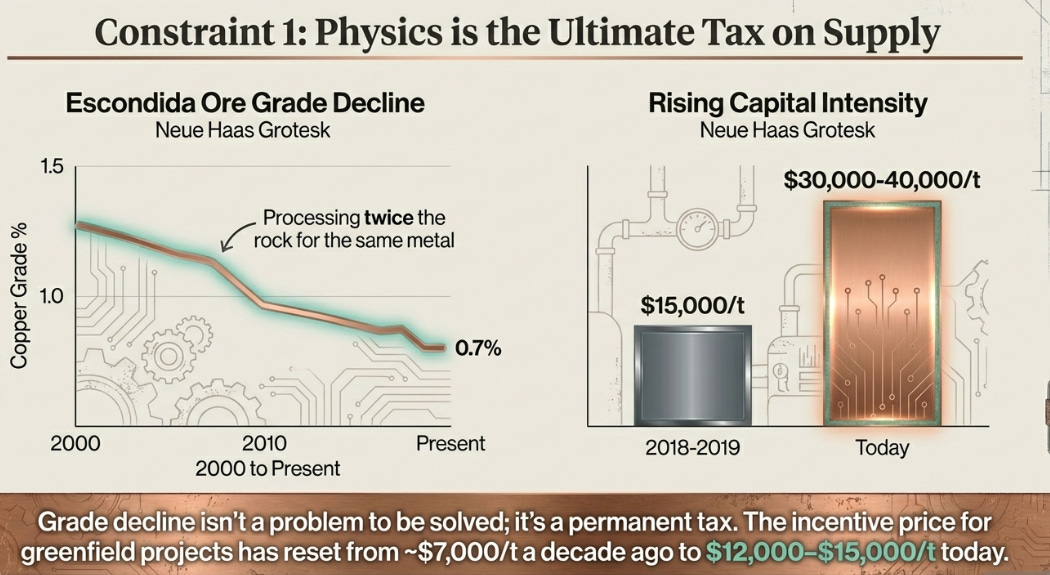
We’ve mined the easy copper. Escondida, the world’s largest copper mine, has watched its ore grade collapse from 1.5% copper content to 0.7% over two decades. Every new tonne requires processing twice the rock. This isn’t a Chile problem, it’s physics. The low-hanging fruit is gone, and what remains is deeper, harder, and exponentially more expensive to extract.
The numbers tell the story: capital intensity for new mines has risen from roughly $15,000 per annual tonne of capacity in 2018-2019 to $30,000-40,000 today. This mechanically pushes the incentive price, the sustained price level required to justify a multi-billion dollar, multi-decade mine investment, from around $7,000 per tonne a decade ago to $12,000-15,000 today. Grade decline isn’t a problem to be solved; it’s a permanent tax on new supply.
The Capital Strike
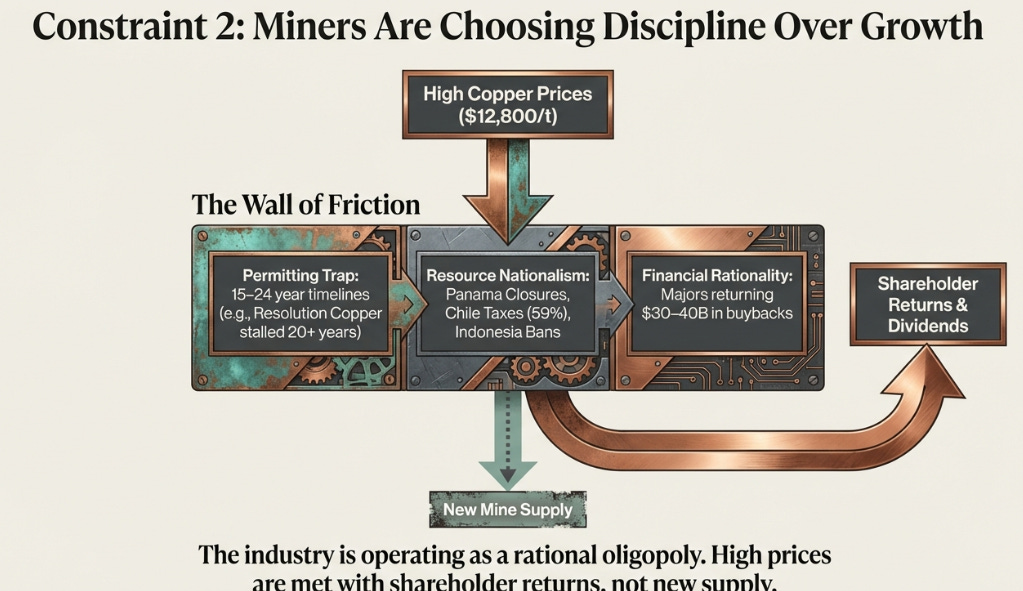
Miners learned their 2011 lesson too well. Burned by the boom-bust cycle, major producers now operate as a rational oligopoly. They’re returning $30-40 billion annually to shareholders through buybacks and dividends rather than digging new holes. BHP, Rio Tinto, and Freeport aren’t being irrational, they’re being disciplined. The problem is that discipline, multiplied across an industry, means supply stays constrained even when prices scream for expansion.
Resolution Copper in Arizona holds 1.8 million tonnes of copper, enough to supply U.S. demand for five years. It’s been in permitting for over 20 years with no end in sight. This isn’t an outlier. Average mine development timelines have stretched from 7-10 years in the 1990s to 15-24 years today. ESG mandates, community opposition, and resource nationalism have created a wall of friction that price signals struggle to penetrate.
Chile just raised effective mining taxes to 59%. Indonesia banned copper concentrate exports. Panama shut down a 350,000-tonne-per-year mine over a constitutional dispute. The world is sending copper a $12,800 price signal. The industry’s response has been constrained by forces that price alone cannot overcome quickly.
The Demand That Won’t Break, Unless China Does
The old copper story was cyclical. China built apartments, prices rose, construction slowed, prices fell. That demand was price-sensitive because it was optional, developers could delay projects, consumers could postpone purchases.
Today’s demand is different. It’s mandated. Electric vehicles require 60-83 kilograms of copper per car, three times an internal combustion engine. This isn’t a consumer choosing greener, it’s automakers racing to meet government regulations in Europe (100% EV by 2035), California (100% by 2035), and China (aggressive subsidies). Tesla can’t redesign the Model 3 to use less copper without sacrificing range. The physics are fixed.
Grid infrastructure is even more inelastic. Utilities must upgrade transmission capacity to accommodate renewable energy, and copper represents less than 2% of a grid project’s total cost but 100% of its functionality. When the U.S. needs to build 21,000 miles of new high-voltage lines to avoid blackouts, the copper line item isn’t negotiable. Underground cables require 19,500 kilograms of copper per kilometer.
And then there’s AI. Microsoft’s 80-megawatt Chicago data center required 2,100 tonnes of copper. The Stargate Project, $500 billion over four years, will consume copper at rates that make EV production look modest. But copper represents a rounding error in data center economics. Google isn’t delaying a $10 billion facility over a $50 million copper bill.
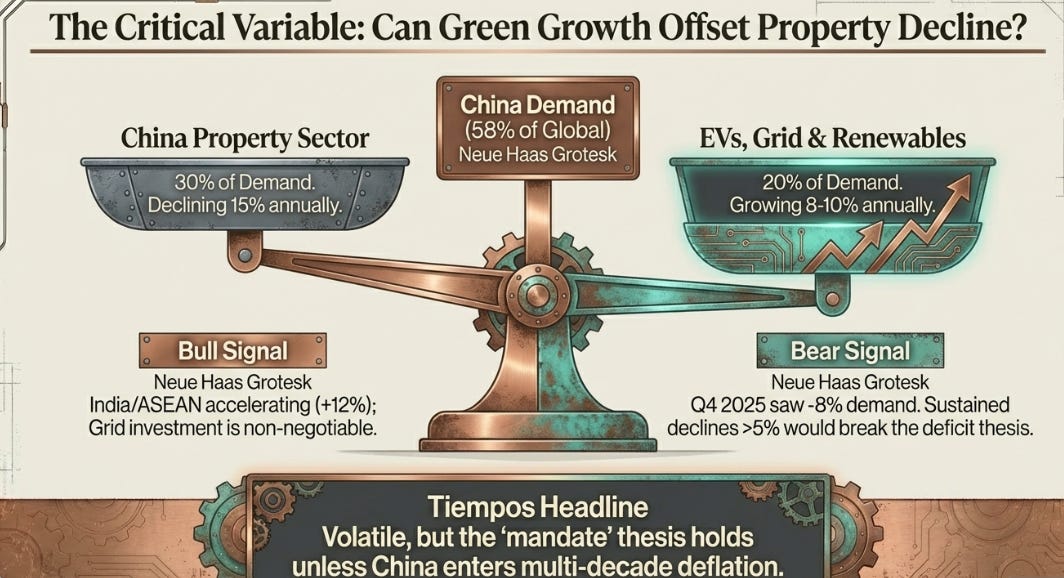
The evidence against this narrative. Fourth quarter 2025 saw Chinese refined copper demand fall 8% year-over-year, the first negative quarter in years outside of COVID. China represents 58% of global copper consumption. The property sector alone accounts for roughly 30% of China’s copper demand, while grid and EV combined represent about 20%. Simple arithmetic: you cannot offset a sector declining 15-20% annually with one growing 8-10% unless EV and grid growth rates accelerate dramatically. China’s EV market share already hit 54% in Q4 2025, suggesting saturation dynamics may be approaching.
Moreover, China has crossed infrastructure inflection points. They’ve built 45,000 km of high-speed rail, installed over 200 GW of solar capacity annually, and achieved near-total smartphone penetration. The marginal returns to additional copper-intensive infrastructure investment are declining.
The Shanghai Futures Exchange provides corroborating evidence: Chinese traders hold net short positions at the widest levels since 2021, while Western funds on the LME are net long at 80th percentile levels. When traders with physical market visibility position opposite to Western speculators, that divergence demands explanation.
Why the constraint still holds. One quarter doesn’t make a trend, particularly when seasonal and cyclical factors are in play. Chinese New Year effects, property developer defaults creating temporary inventory liquidation, and the timing of grid projects all create quarterly volatility. The relevant question is whether Q4 2025’s -8% reflects permanent demand destruction or timing effects.
Three factors suggest the latter: First, Chinese government policy remains committed to EV penetration (targeting 80% by 2030) and grid expansion (renewable integration requires transmission buildout regardless of property sector weakness). Second, India and ASEAN are accelerating copper-intensive infrastructure at rates that can partially offset Chinese weakness, India alone grew copper demand 12% in 2025. Third, the Shanghai traders’ net short position could reflect hedging behavior (fabricators locking in input costs) rather than directional bets on demand.
The critical test arrives in Q1-Q2 2026. If Chinese demand shows two consecutive quarters below -5% year-over-year, the constraint breaks. If it stabilizes around 0-1% growth, the mandate-driven demand thesis holds despite the property sector headwind.
The Substitution Problem: Real But Insufficient
Before going further, it’s essential to address the obvious counterargument: if copper prices stay elevated, won’t aluminum substitution solve the shortage?
The answer is yes, and no. Substitution is already happening and will accelerate. But the arithmetic suggests it won’t be enough to prevent sustained higher pricing.
Where substitution works. HVAC systems have already shifted from 20% aluminum to 40% over the past six years. At current copper-to-aluminum price ratios (4.2x versus a historical 3.5x trigger point), that share could reach 60% by 2028. In automotive wiring harnesses, manufacturers are targeting 25-30% aluminum content by 2027, up from 10% today. For EV cables specifically, this could reduce copper intensity from 83kg per vehicle to around 60kg, a meaningful 28% reduction.
Long-distance transmission lines are also shifting. China already uses aluminum for 60% of its high-voltage DC transmission. At $13,000+ copper, U.S. and European utilities are following suit for new projects where conductivity trade-offs are acceptable.
The cumulative impact over three years: roughly 1.2-1.5 million tonnes of demand destruction. That’s 400,000-500,000 tonnes annually, a significant number.
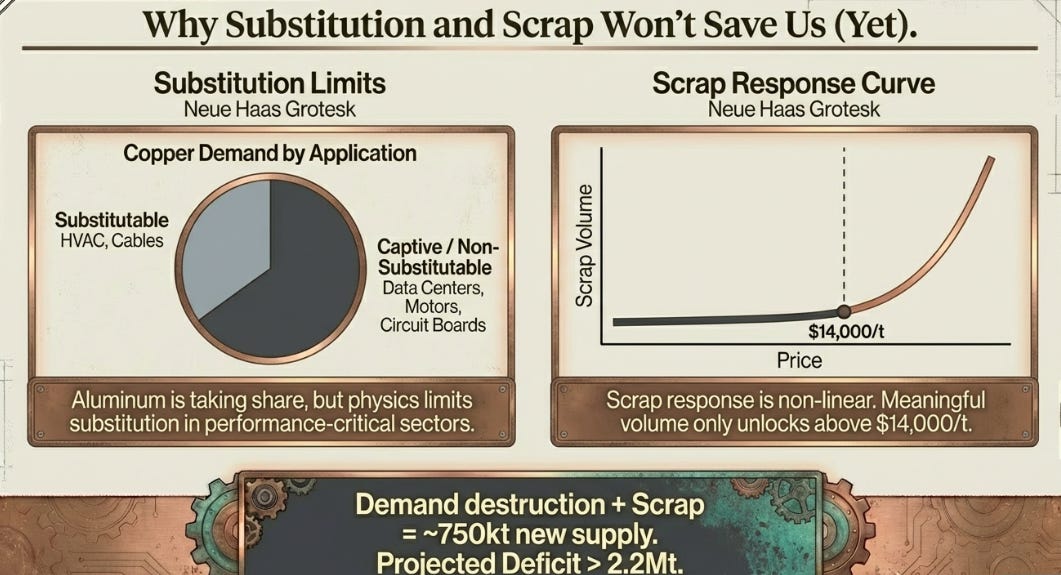
Where physics forbids it. But substitution has hard limits. Data centers can’t use aluminum for critical power distribution, voltage drop and space constraints require copper’s superior conductivity. Electric motors in EVs and industrial equipment are already optimized to thermodynamic limits; aluminum would require complete redesigns that sacrifice efficiency. Underground distribution cables can’t substitute due to space limitations in urban conduits. Electronics and printed circuit boards have no viable alternative at current miniaturization requirements.
These “captive” applications represent 60-70% of total copper demand. They’re not substitutable at any economically relevant price point this decade.
The scrap response curve. At current prices around $12,800 per tonne, recycling economics have already shifted. Approximately 30% of global copper supply (roughly 8-9 million tonnes) comes from scrap. The price-response function is non-linear:
Below $11,000/t: Scrap flows are relatively inelastic, driven primarily by regulated demolition and manufacturing waste streams. These are contractual and don’t respond quickly to price.
$11,000-13,000/t: Scrap flows increase roughly 50,000 tonnes per $1,000 price increase as industrial recyclers optimize collection and processing becomes more profitable. At $13,000, this adds approximately 100,000-150,000 tonnes annually versus the $11,000 baseline.
Above $14,000/t: Informal networks activate, demolition accelerates, wire theft increases, building teardowns target copper-intensive components. This is a step-function, potentially adding 300-500,000 tonnes annually as price-insensitive inventory gets mobilized.
The constraint is processing capacity: recycling infrastructure (collection networks, sorting facilities, smelters configured for scrap) can’t scale overnight. Chinese traders are already stockpiling scrap aggressively, which limits immediate availability but creates a buffer for future processing.
The net calculation. Annual copper demand is approximately 28-29 million tonnes. Substitution might reduce this by 400-500kt per year at current price levels. Increased scrap flows add 150-200kt annually at $13,000, potentially 400-500kt if prices reach $15,000+. Combined: 550-750kt of “new supply” from demand destruction and recycling at $13,000, scaling to 900-1,000kt at $15,000+.
But the projected supply-demand gap is 150-330kt annually, with cumulative deficits reaching 2.2-2.4 million tonnes by 2031. Substitution and scrap slow the deficit accumulation, they don’t eliminate it below $15,000.
Moreover, substitution creates its own constraint: aluminum prices. As copper users shift to aluminum, aluminum prices rise (already up 40% since 2020). At aluminum above $3,000-3,500 per tonne, the economic case for substitution weakens substantially. The copper-to-aluminum ratio that triggers substitution (historically 3.5-4.5x) becomes harder to maintain if both metals rise together.
The implication: substitution and scrap cap copper’s upside (probably around $17,000-18,000 rather than $20,000+), but don’t restore the old equilibrium pricing of $7,000-9,000 per tonne.
The Signal from the Plumbing
If you want to know whether copper is truly scarce or just experiencing a sentiment-driven spike, ignore the price. Watch the plumbing.
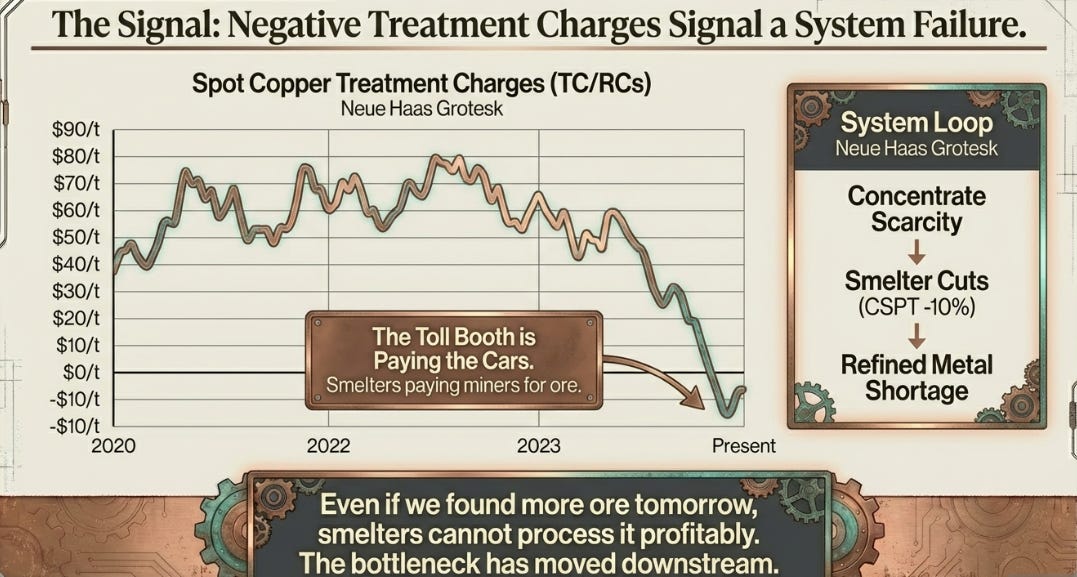
Treatment Charges (TC/RCs) are the fee smelters charge miners to turn raw copper ore into usable metal cathodes. Think of them as the toll for crossing from rock to refined copper. In 2024, that toll was $80 per tonne. In 2026, the benchmark collapsed to $0. Spot rates have gone negative, smelters are now paying miners up to $65 per tonne for the privilege of processing their ore.
This has never happened before. Not in 2008. Not in 2011. Never.
What it signals is unambiguous: there isn’t enough copper ore to keep the world’s smelters running profitably. The China Smelters Purchase Team (CSPT), representing the processors who turn 60% of the world’s copper ore into usable metal, has announced production cuts exceeding 10%. That’s 638,000 tonnes of refined copper disappearing from global supply, not because demand is weak, but because the upstream system has run dry.
Here’s where the system dynamics become concerning: even if a new mountain of copper ore were discovered tomorrow, there isn’t enough profitable smelting capacity to turn it into the cathodes the world actually needs. The bottleneck has moved from the mine to the factory. And when smelters cut production to survive, they guarantee a refined copper shortage regardless of what happens upstream.
This creates a feedback loop with limited exit paths. Concentrate scarcity forces smelter cuts. Smelter cuts create refined copper shortages. Shortages drive prices higher. Higher prices incentivize more concentrate production. But smelters still can’t process it profitably. The loop continues.
The counterargument: TC/RCs always recover. Smelter margins have collapsed before (2004-2006, 2016-2017) and rebalanced within 12-18 months. The current crisis, while unprecedented in reaching negative territory, may simply be an extreme version of a cyclical pattern. If the announced 10% Chinese smelter cuts eliminate 960,000 tonnes of concentrate demand, that’s larger than the estimated 834,000 tonne concentrate deficit. By Q4 2026, TC/RCs could recover to $30-50 per tonne, smelters restart production, and refined copper supply surges in H1 2027.
This is plausible. But it assumes the cuts are sufficient and Chinese smelters don’t face continued profitability pressures from environmental regulations (which have been tightening). If TC/RCs stay depressed through 2026, it validates that the concentrate shortage is structural, not transient.
The Inventory That Disappeared
On paper, global copper inventories look adequate. Dig deeper, and you find a market that has fragmented into semi-walled pools where location matters more than quantity.
COMEX warehouses in the United States hold 515,000 tonnes of copper, a record high, five times year-ago levels. The London Metal Exchange holds 114,000 tonnes, less than one day of global consumption. Shanghai holds 213,000 tonnes. The total system inventory of 3-4 million tonnes should be enough to absorb normal shocks.
Except the distribution isn’t normal anymore. Here’s why location now matters more than volume:
95% of LME on-warrant inventory is Russian or Chinese in origin. Due to sanctions, sourcing preferences, and quality specifications, only 3% of LME stock is deliverable into COMEX contracts. The copper exists, but it’s trapped behind policy walls. A fabricator in Germany can’t easily access the 515,000 tonnes sitting in Baltimore any more than a driver in California can fill up at a gas station in Texas during a regional shortage.
The fragmentation was created deliberately. When the U.S. imposed 50% tariffs on semi-finished copper products in August 2025, traders responded by relocating massive tonnage into COMEX warehouses as an arbitrage play. The COMEX-LME spread peaked at 27% ($3,400 per tonne) in July 2025. That gap has since collapsed to 2-3%, but the structural damage persists: the copper that relocated to the U.S. during the spread blowout isn’t easily flowing back.
What this means in practice: the ex-U.S. market is operating with less than 3 days of inventory coverage versus a “comfortable” level of 15-25 days. The Shanghai exchange is slightly better at 3-4 days. The London exchange is running on under 1 day.
But here’s the bear case embedded in this fragmentation: The 515,000 tonnes sitting in U.S. warehouses represents 65% of the consensus 2026 deficit estimate. Bears argue this copper isn’t “trapped”, it’s temporarily misallocated and will flow back to global markets once tariff uncertainty resolves. Historical precedent supports this: China’s aluminum strategic reserve has been released multiple times when prices spike. The U.S. Strategic Petroleum Reserve has been tapped repeatedly. Inventory that’s “politically unavailable” has a way of becoming available when the political calculus changes.
On June 30, 2026, the U.S. Commerce Department will decide whether to extend tariffs to refined copper cathodes (15% starting January 2027, rising to 30% by 2028). If tariffs are abandoned, 200-300,000 tonnes could flow back into global circulation over 6-12 months, creating a meaningful 10-15% price correction. If tariffs are implemented or extended, the fragmentation becomes more permanent.
When buffers disappear, the relationship between supply deficits and price changes becomes exponential, not linear. A 200,000-tonne deficit in a well-buffered market might push prices up 10%. The same deficit in a system with near-zero slack can trigger 30-50% spikes in weeks.
What the Market Gets Wrong
The consensus view treating current prices as a temporary, disruption-driven spike is anchored to evidence that no longer applies.
Analysts see Grasberg (Indonesia’s giant mine, offline since September 2025 due to flooding) as a one-off accident. They expect a phased restart in Q2 2026 with full production by late 2027, adding 600,000 tonnes back to global supply. They model Cobre Panama, shuttered since November 2023, with a “best case” Q2 2026 restart adding another 350,000 tonnes annually.
The variant perspective: these aren’t accidents. They’re symptoms.
Grasberg’s flooding wasn’t bad luck, it’s what happens when you mine a massive open pit in a region with 4,000mm of annual rainfall at increasing depths. El Teniente in Chile suffered a rock burst in July 2025 (a seismic event triggered by stress from 100+ years of mining). Kamoa-Kakula in the Congo lost 150,000-180,000 tonnes of output to seismic flooding in May 2025. These are predictable consequences of an aging, stressed, underinvested supply system pushed to its operational limits.
More fundamentally, even if these mines restart on schedule, the arithmetic doesn’t resolve. Global mine production grew 1.4% in 2025 versus expectations of 2.3%. For 2026, the forecast is 23.9 million tonnes of mine supply versus 28.7 million tonnes of demand. That’s a 150-330,000 tonne deficit even assuming everything goes right. Cumulative deficits through 2031 could reach 2.2-2.4 million tonnes, and that’s before accounting for potential new disruptions or demand surprises.
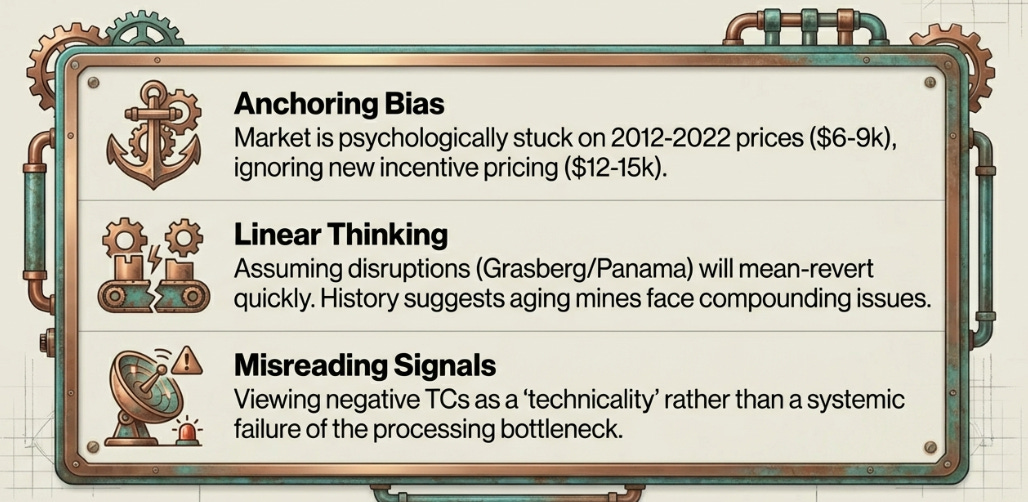
The market is making three analytical errors:
Anchoring. Every analyst and trader is psychologically anchored to the 2012-2022 price range of $6,000-9,000 per tonne. Anything above $10,000 “feels expensive” regardless of the new fundamental reality. But this anchoring ignores that the cost structure of the industry has fundamentally changed, incentive pricing for greenfield projects has risen from $7,000 per tonne a decade ago to $12,000-15,000 today due to grade decline, capital intensity inflation, and political risk premiums.
Misreading the smelter signal. The market sees negative Treatment Charges as a technical curiosity, a “margin problem for Chinese processors.” It’s better understood as a systemic constraint that proves the concentrate shortage is real and creates a guaranteed refined metal shortage that high prices alone cannot solve because the bottleneck is now at processing, not extraction.
Linear thinking in a non-linear system. Consensus models assume disruptions resolve → supply normalizes → prices mean-revert. This worked when the market had 20-25 days of inventory buffer. With 3-5 days of coverage ex-U.S., small deficits now trigger exponential price responses. The relationship between shortage magnitude and price change has shifted, but the models haven’t updated.
The Three-Year Path
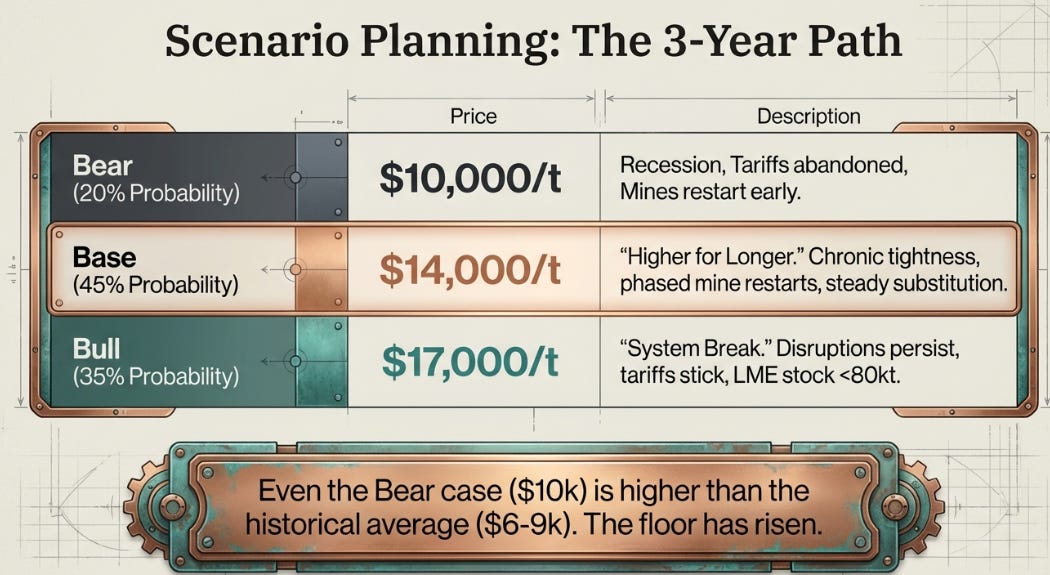
Forecasting commodity prices three years out is usually an exercise in overconfidence. But when the range of plausible outcomes is itself informative, when the distribution matters more than the point estimate, scenario planning becomes useful.
Bull case (35% probability): $17,000/t
This is the scenario where the three constraints remain binding and the system experiences violent repricing.
Grasberg’s restart is delayed beyond Q4 2026 or production disappoints relative to targets. Cobre Panama’s political resolution fails and the mine stays shuttered. June tariffs are implemented with minimal exemptions, permanently fragmenting the market. China surprises with a major stimulus package, adding 2-3% demand growth. Treatment Charges stay at or below zero through 2026, forcing additional 10% smelter cuts beyond the initial wave. LME inventories fall below 80,000 tonnes, the critical shortage threshold where days of coverage drops under 0.5.
In this scenario, Q3 2026 sees an LME squeeze driving the cash-to-three-month spread to a premium exceeding $500 per tonne. Prices break $15,000 by Q4 2026 as smelter cuts hit the refined market. 2027 is characterized by sustained $15,000-17,000 pricing as the system remains in acute shortage. By 2028, marginal projects finally get sanctioned at $16,000-17,000 incentive pricing, but their production won’t arrive until 2032-2035.
Base case (45% probability): $14,000/t
This is the “higher for longer” scenario where the system stays tight but doesn’t break catastrophically.
Grasberg restarts on schedule with phased production through 2026 and full output by late 2027 per Deutsche Bank’s timeline. Cobre Panama remains in political/legal limbo with no resolution before 2027. The June tariff decision gets extended or delayed, keeping uncertainty alive but avoiding extremes. China demand stabilizes at 0-1% growth as grid and renewable investment partially offsets continued property sector weakness. Treatment Charges oscillate between $0-30 per tonne, chronic tightness without full-blown crisis. Substitution proceeds as outlined (1.2-1.5 million tonnes of demand reduction over three years). Scrap flows increase modestly, adding 150-200kt annually at current prices, potentially 300-400kt if prices approach $15,000. Annual deficits of 150-200,000 tonnes persist through 2027.
Post-tariff decision in Q3 2026, prices consolidate in the $12,500-13,500 range. 2027 is characterized by recurring spikes to $15,000 on low inventories and supply hiccups, followed by pullbacks as immediate tightness eases. By 2028, partial rebalancing occurs as Grasberg and Kamoa reach full production and substitution begins to meaningfully impact demand. Prices settle into a $13,000-14,000 band.
This isn’t mean reversion to the old world. It’s a structural repricing where $11,000-12,000 becomes the new floor (versus $6,000-7,000 pre-2020) because incentive pricing for greenfield projects has permanently reset higher.
Bear case (20% probability): $10,000/t
This is the scenario where multiple tailwinds align to restore market balance faster than bulls expect.
A global recession hits, cutting demand growth from 2-3% to flat or negative. The June tariff decision abandons or indefinitely delays refined copper tariffs, triggering a COMEX inventory unwind as 300,000 tonnes flows back into global markets over 12 months. Both Grasberg and Cobre Panama restart in H2 2026 and ramp faster than expected. Treatment Charges recover to $50+ per tonne by Q4 2026 as the concentrate market rebalances, prompting smelters to restart production and rebuild refined output. LME inventories rebuild above 250,000 tonnes. Substitution accelerates more aggressively, approaching 2 million tonnes of demand destruction over three years as the copper-to-aluminum price ratio sustains above 5.0x. Scrap flows surge to 500-700kt annually as informal networks fully activate at sustained high prices.
In this scenario, Q3 2026 sees prices break $11,000 as the COMEX unwind begins. 2027 brings a surplus despite earlier deficit forecasts as supply recovers and demand weakens. By 2028, prices stabilize in the $9,500-10,500 range, still above the historical $6,000-7,000 floor because structural cost increases have raised the 90th percentile production cost from $4,500 to $6,500-7,000 per tonne.
Even in this bearish scenario, copper doesn’t return to 2015-2020 pricing. The floor has permanently shifted higher.
The Scoreboard
Variant perspectives are only useful if they’re falsifiable. Here are the ten metrics that will reveal which scenario is unfolding:
Watch weekly:
LME inventory: Below 80,000 tonnes confirms bull case (critical shortage). Above 250,000 tonnes confirms bear case (buffer restored).
COMEX inventory: Below 400,000 tonnes means metal is trapped as expected. Above 600,000 tonnes means unwind is accelerating (bearish).
Copper-to-aluminum price ratio: Above 5.0x triggers wholesale substitution (bearish for copper demand). Currently 4.2x.
Watch monthly:
Spot Treatment Charges: Below $0 confirms concentrate crisis persists (bullish). Above $50 per tonne signals rebalancing (bearish).
China refined copper demand year-over-year: Below -5% for two consecutive quarters invalidates structural deficit thesis. Above +2% for two quarters confirms bull case.
Yangshan import premium: Above $80 per tonne means China is pulling aggressively (tight market). Below $30 per tonne signals weak demand.
Watch quarterly:
Grasberg production: On-track means 1.2-1.4 billion pounds for 2026 (base case). Below 1.0 billion pounds means delays (bullish).
CSPT smelter actions: Additional production cuts beyond the announced 10% confirm escalating crisis (bullish). Restart announcements signal easing (bearish).
Major project approvals: Any 200,000+ tonne-per-year project formally shelved or canceled (Resolution, Pebble) confirms political/ESG constraints are binding (bullish long-term). New mega-project sanctions signal incentive pricing is working (bearish long-term, but production won’t arrive for a decade).
The binary event:
June 30, 2026: U.S. Commerce Department tariff decision. Abandonment triggers COMEX unwind and 10-15% correction. Full implementation intensifies fragmentation and ex-U.S. shortage.
The falsification trigger: If you observe sustained inventory builds (LME and SHFE), Treatment Charge recovery above $50 per tonne, and market structure flipping to contango simultaneously for multiple months, the thesis is wrong. Exit.
Conversely, if LME stays below 100,000 tonnes, TC/RCs remain near zero, and backwardation persists despite mine restarts through Q4 2026, the structural shortage thesis is confirmed.
The Call
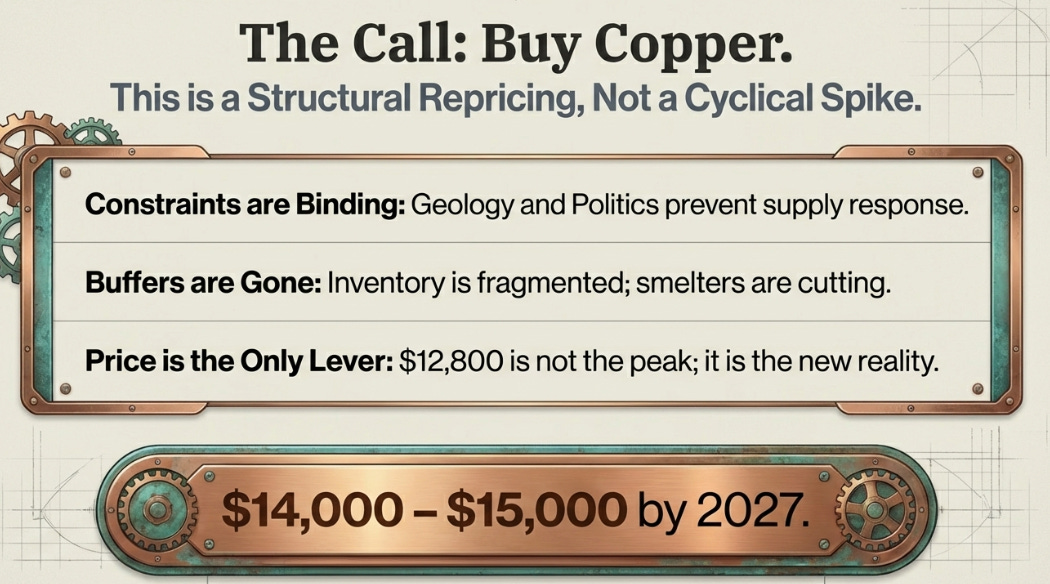
Buy copper.
This isn’t a bet on a commodity cycle. It’s a position on a structural repricing of a resource that has become as critical as oil was in the 20th century, but with a supply response that is an order of magnitude slower.
The three constraints, geology, politics, and demand inelasticity, remain binding. Grade decline is irreversible. Capital discipline and permitting timelines mean price signals can’t reach investment decisions on relevant timeframes. And mandated demand for decarbonization means consumption is less price-sensitive than historical patterns suggest, provided China’s -8% Q4 2025 demand decline proves transient rather than structural.
When buffers disappear and supply can’t respond, price becomes the only adjustment mechanism. And mechanisms that work through pain rather than moderation don’t produce gentle outcomes.
The consensus sees $12,800 per tonne as expensive because they’re anchored to the 2012-2022 range. The variant view is that $12,800 represents the market’s initial recognition that copper has entered a structurally higher pricing regime, where the old equilibrium of $6,000-9,000 per tonne no longer reflects the economic reality of bringing new supply to market.
Three-year target: $14,000-15,000 per tonne by end-2027, with a 35% probability of spikes to $17,000+ if constraints don’t ease. The base case isn’t gentle mean reversion to historical averages, it’s a higher floor with recurring explosive moves whenever the system’s diminished buffers get tested.
The primary risk is a severe global recession that cuts demand growth to zero or negative. But even that scenario doesn’t invalidate the long-term thesis, it would simply halt nascent mine investment, deepen the structural supply gap, and set up more violent repricing on the other side.
The question isn’t whether copper averages above $12,000 per tonne for the rest of the decade. The question is whether it needs to spike higher, to $15,000, $18,000, or beyond, to finally inflict enough pain through demand destruction or political emergency to force the system to rebalance.
Disclaimer:
The content does not constitute any kind of investment or financial advice. Kindly reach out to your advisor for any investment-related advice. Please refer to the tab “Legal | Disclaimer” to read the complete disclaimer.
This is Tier 1 analysis. An incredible level of balanced research and a stand out report on substack! Bravo.
This piece realy made me think. Your insight into the new supply dynamics is spot on. It makes me wonder, what if AI-driven exploration did reach a breakthrough eventually? Beyond 2028, could deep learning models redefine discovery timelines for these resources? It's a fascinating challenge.