


TL; DR
The margin arrived from an unexpected direction: adjusted gross margin rose 200 basis points to an all-time high even though net revenue margin was unchanged. DoorDash did not charge more; the fulfillment system became more efficient.
The Digital Shelf remains under-monetized: DashPass is accelerating grocery adoption, advertising is already contributing to earnings, and merchant relationships contain commercial value that DoorDash has yet to quantify or fully exercise.
Per-share conversion remains the constraint: the widening GAAP-to-adjusted gap, stock compensation, recurring legal costs and continued reinvestment mean stronger network economics may not flow cleanly to shareholders.
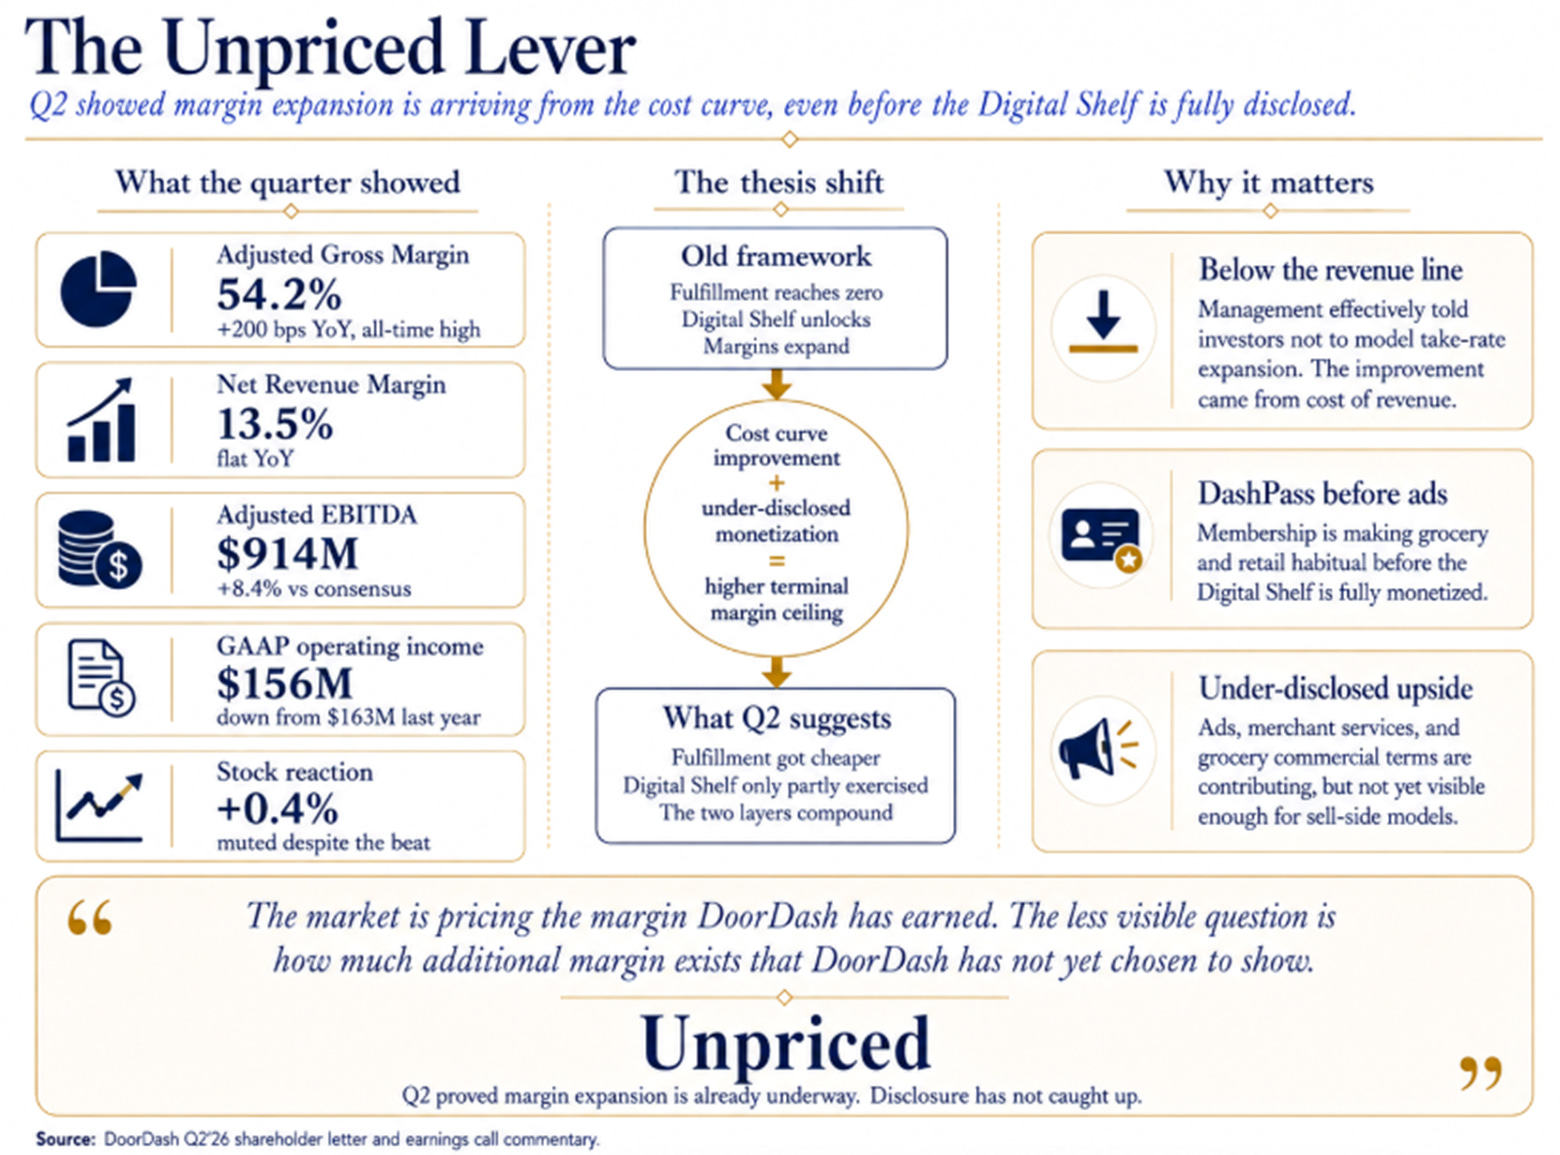
Two numbers from DoorDash’s second quarter define everything that follows.
Adjusted Gross Margin: 54.2%. All-time high. Up two hundred basis points year-over-year. Net Revenue Margin: 13.5%. Identical to Q2 2025. To the decimal. DoorDash expanded margins by two hundred basis points without moving its take rate a single basis point.
Adjusted EBITDA of $914 million beat consensus by 8.4% and cleared the top of management’s own guidance range. GAAP operating income was $156 million, down from $163 million a year ago on 36% revenue growth, missing consensus by 19%. The stock moved four-tenths of a percent.
In The Two Businesses Inside after Q1, I wrote that margin expansion had to come from the intent layer, because: “Marginal costs are real and irreducible. Labor scales linearly with volume.” In The Meituan Referendum after Q4, I identified the Digital Shelf, grocery-enabled CPG advertising, as the single variable determining whether DoorDash was a $150 stock or a $300 stock. Both pieces assumed the fulfillment layer was the substrate that needed to reach zero. The intent layer was where the margin lived.
That framework needs correcting. The fulfillment layer didn’t get to zero. It got cheaper. On its own. While the intent layer had only been partly exercised.
Management knows it. They broke their shareholder letter format, said so explicitly, and spent five pages arguing DoorDash is a compounding membership flywheel, organized around strategy rather than financial results. They published two cohort charts they have never shown before: Adjusted Gross Profit per MAU and DashPass penetration compounding together over five years. Ravi Inukonda volunteered that the EBITDA beat came “later in the quarter” and they didn’t have time to reinvest, pre-framing Q3 before anyone asked. Twelve analysts asked questions. Not one pushed back.
This is a management team constructing the communication infrastructure for reclassification. The cohort charts are not evidence offered in passing. They are strategy. And the sell side is buying the narrative without interrogation.
The Cost Curve
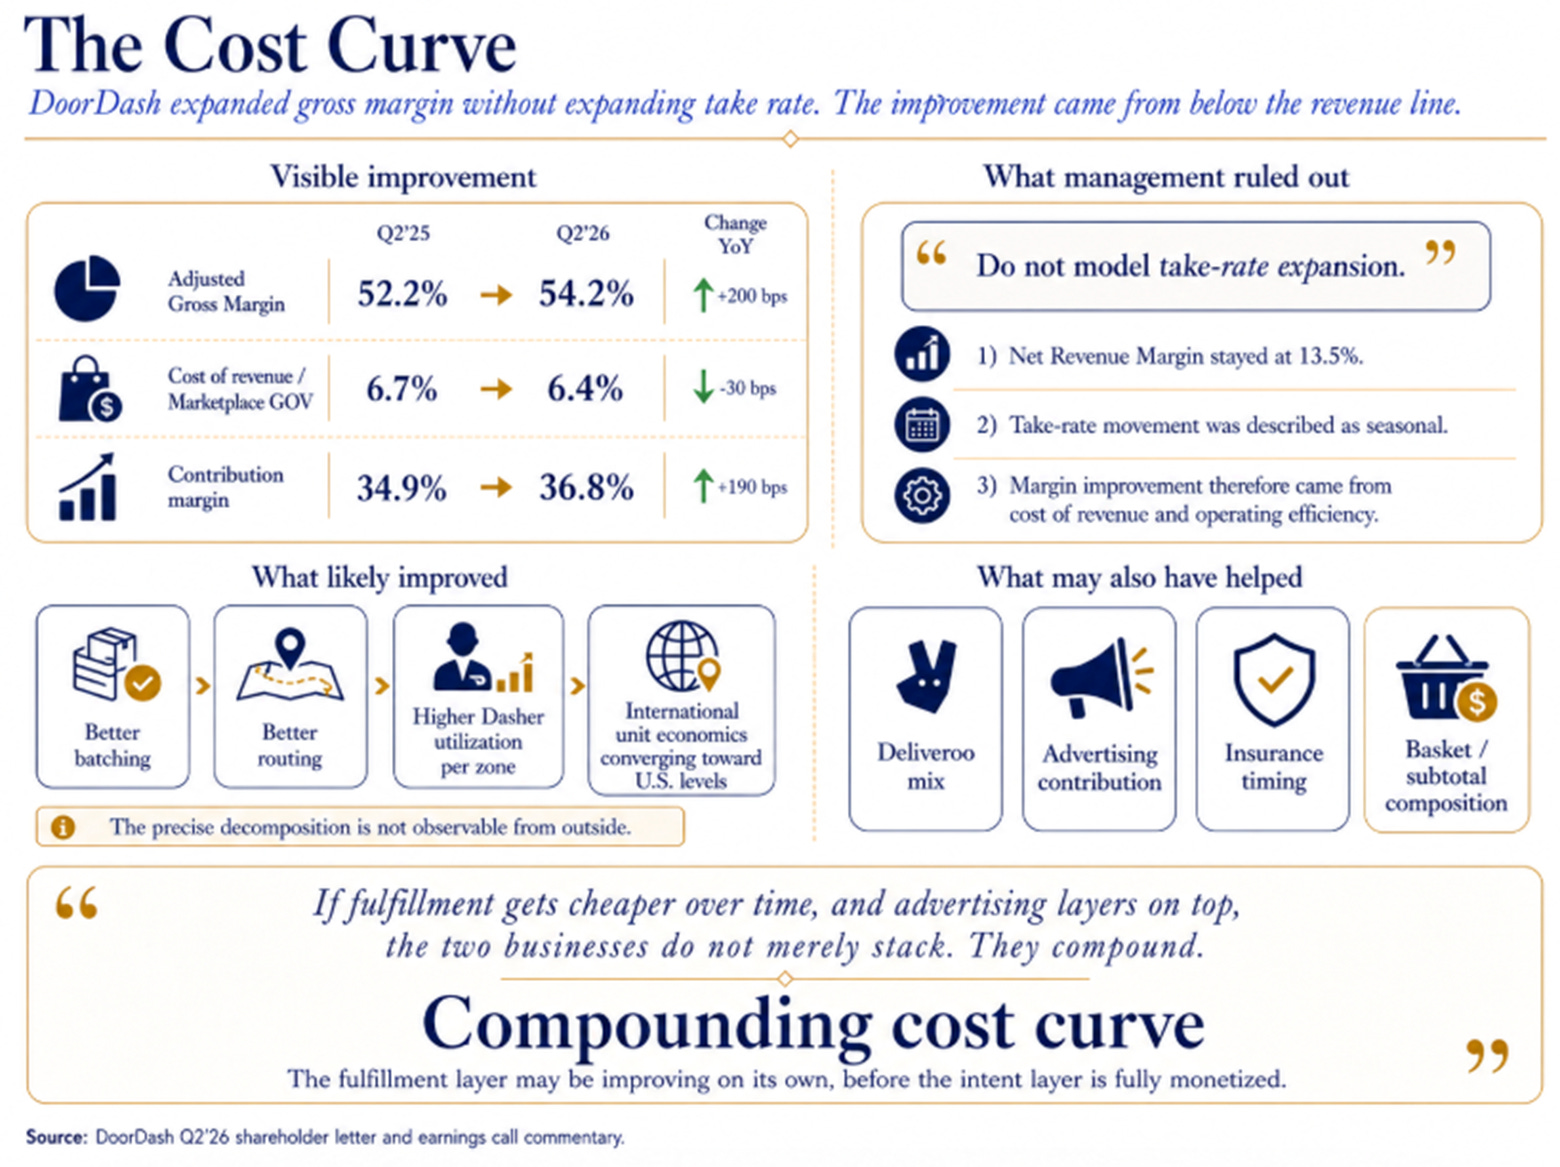
Here is the mechanism behind the 200 basis points, and the caveat that matters.
Cost of revenue, as a percentage of Marketplace GOV, fell from 6.7% in Q2 2025 to 6.4% in Q2 2026. Contribution margin went from 34.9% to 36.8%. When Doug Anmuth of JP Morgan asked about the take rate improvement, Ravi gave an answer more useful for what it ruled out:
We’re not operating the business towards take rate or net revenue margin percentage. Our goal has been always to optimize for overall profit dollars… I would think about it as flattish from Q2 to Q3, and then Q4, which is normally a quarter with higher Dasher costs, it’ll be slightly lower.
Management is guiding you not to model take rate expansion. The margin improvement came from below the revenue line.
I should be precise about what this does and does not prove. The year-over-year comparison strips out seasonality, Q2 2025 had the same seasonal Dasher cost profile as Q2 2026, and adjusted gross margin was 52.2% then versus 54.2% now. That is not a seasonal pattern. It is also not fully explained by Deliveroo consolidation, since Deliveroo was already contributing in Q4 2025 and Q1 2026 without producing a comparable gross margin expansion.
The evidence is consistent with a density-driven cost curve: better batching, routing, Dasher utilization per zone, and international unit economics converging toward the US standard. But the materials do not provide a full bridge showing how much came from structural delivery efficiency versus Deliveroo mix, advertising contribution, insurance timing, or basket composition. Management cited ads and subtotal as specific drivers and attributed take rate movement primarily to seasonal Dasher costs.
The honest read: something structural improved in the economics of fulfillment. The precise decomposition is not observable from outside. The direction of the change matters more than the magnitude of any single quarter, because if fulfillment itself has an improving cost curve at DoorDash’s density, it changes the architecture of the entire thesis.
The prior articles framed it as: fulfillment gets to zero, then advertising takes over. The actual structure may be different. If fulfillment gets cheaper over time, and advertising layers on top, the two businesses don’t merely stack. They compound. That shifts the terminal margin ceiling upward, not by the 200 basis points per year I asserted in an earlier draft (one quarter does not establish an annual rate, and cost curves flatten as efficiency improves), but by a cumulative 100-200 basis points through 2029 in a base case, with more available in a bull case where the global technology platform and autonomous delivery contribute additional gains.
Directionally, DoorDash’s delivery economics appear to be converging toward Uber’s levels on a steeper improvement trajectory, though segment definitions differ enough that a precise numerical comparison is unreliable. The conceptual point stands: DoorDash has order-volume share leadership and the relationship between density and delivery cost is non-linear. A logistics business whose unit costs decline non-linearly with scale is exhibiting economics that sit somewhere between pure logistics and platform.
DashPass Before the Digital Shelf
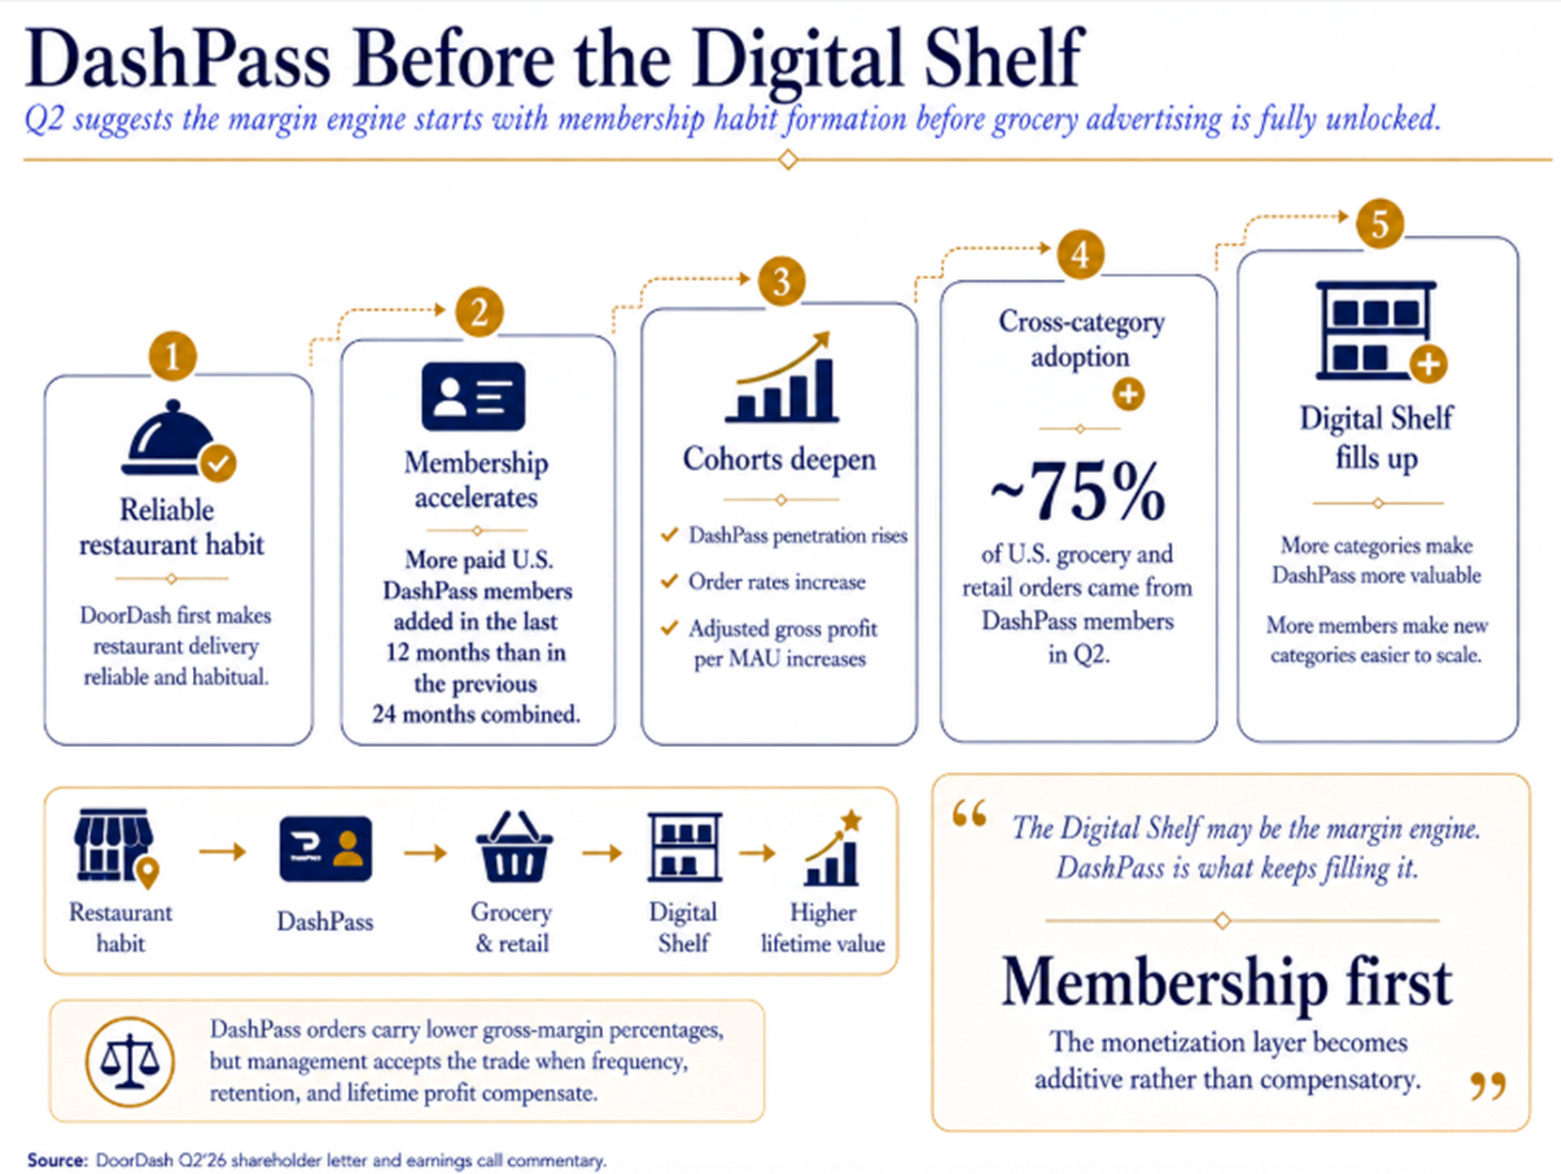
The most important update to the earlier thesis is one of sequencing.
The prior articles assumed the path ran: grocery reaches breakeven → CPG advertising unlocks → margins expand. Q2 suggests the mechanism starts one step earlier.
DoorDash disclosed that it added more paid U.S. DashPass members in the twelve months through Q2 than in the previous twenty-four months combined. As cohorts age, DashPass penetration rises, order rates increase, and adjusted gross profit per MAU increases. Most tellingly: DashPass members placed approximately 75% of U.S. grocery and retail orders during Q2.
DoorDash is not acquiring a restaurant consumer and then separately acquiring a grocery consumer. It is making restaurant delivery reliable enough to become habitual, converting the habitual consumer into a member, and using membership to lower the cost of trying grocery and retail. More categories make DashPass more valuable. More DashPass members make new categories easier to scale. The Digital Shelf may be the margin engine. DashPass is what keeps filling it.
There is a cost to this loop. DashPass orders carry lower gross-margin percentages because members pay lower consumer fees. Management accepts this trade when frequency, retention, and lifetime profit compensate, and Q2’s cohort charts argue it does. But the company still does not disclose the cohort-level cash economics needed to settle the question quantitatively. The direction is clear. The magnitude is taken on trust.
The Lever Nobody Asked About
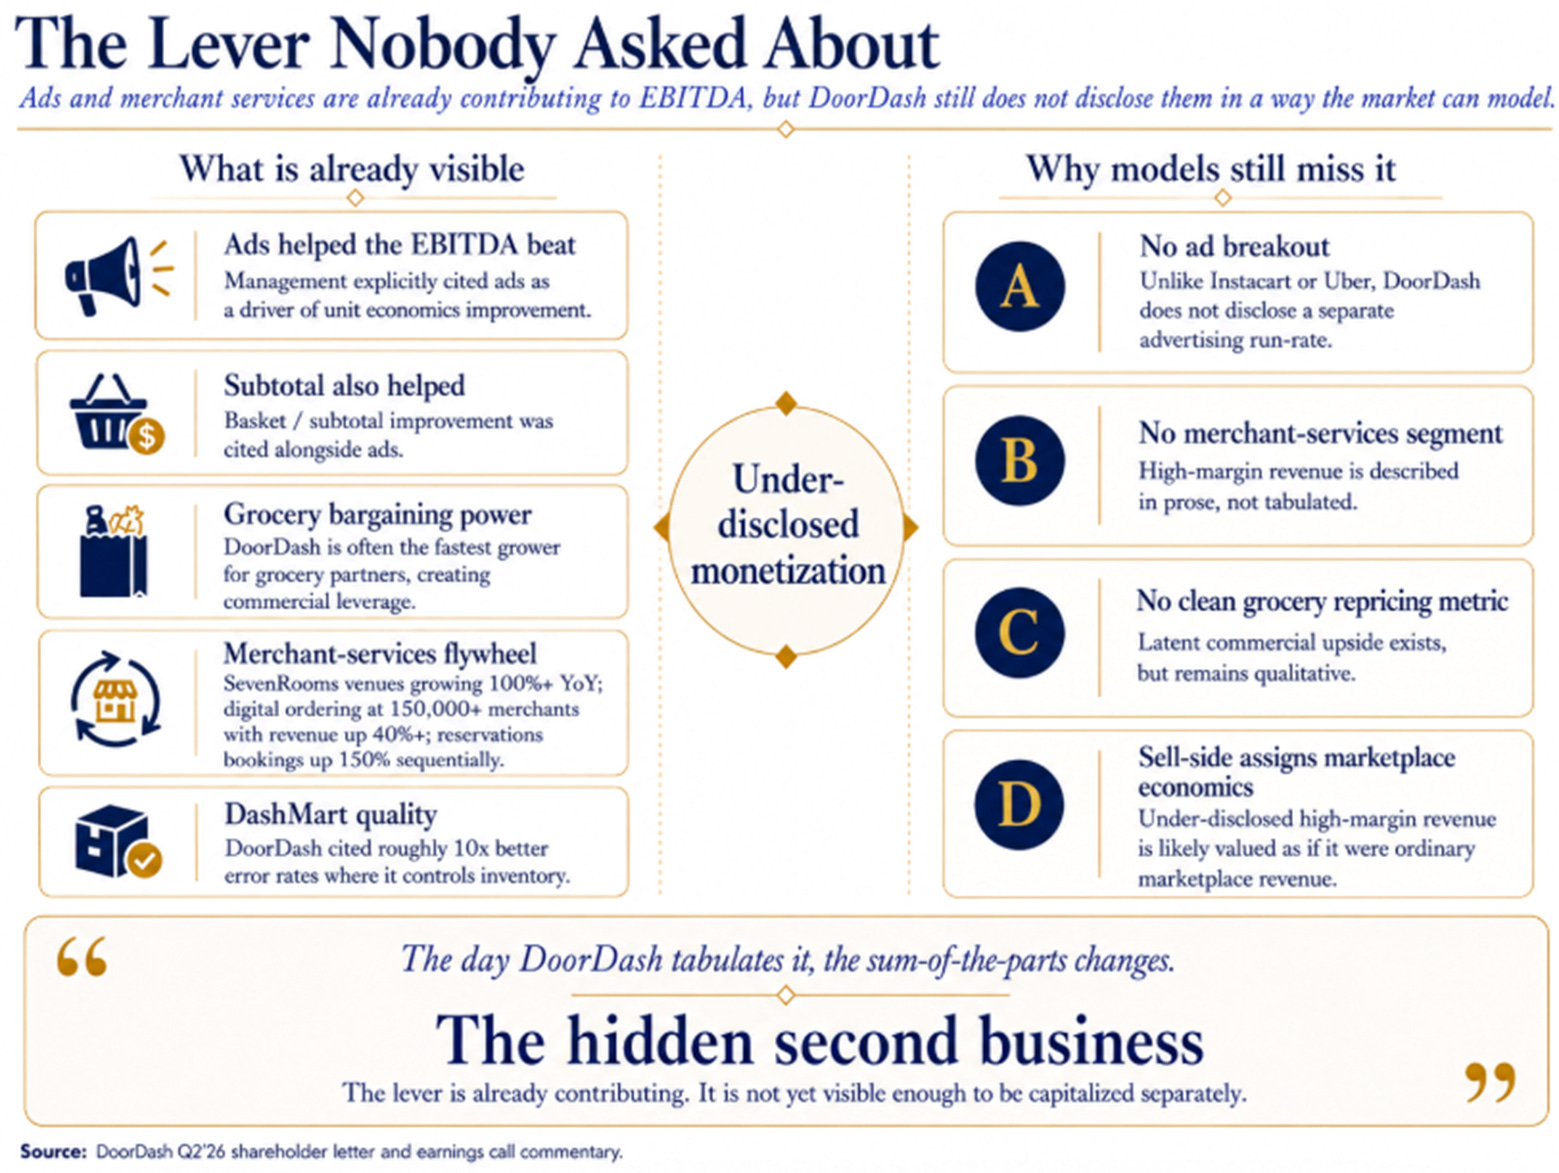
If the cost curve is doing margin work on its own, the monetization layer becomes additive rather than compensatory. That changes the math.
Michael Morton of MoffettNathanson opened Q&A with the question that matters most. Some grocery partners reportedly pay near-zero take rates. What’s the repricing opportunity? Tony Xu declined to comment on any specific partner, then said this:
When you are the fastest grower in the market for them, and you are their source of growth, we might be 100% of the growth that they see, you certainly have opportunities to grow your business with them.
I don’t want to overstate what that means. “Opportunities to grow your business with them” could mean higher take rates, but it could also mean advertising, fulfillment services, data products, or expanded assortment. It is not a confirmation of unused pricing power. It is a statement that commercial bargaining position exists and management sees ways to monetize it. But it is still a CEO describing latent economic value in a relationship the market cannot observe.
The grocery thesis is advancing alongside it. DashMart warehouses run near 24/7 with what Tony described as “10x better error rates” because DoorDash controls the inventory. The blind storefront problem I identified in The Ice King, the information layer promising something the physical layer cannot reliably deliver, is being solved through vertical integration, exactly as the Tudor framework predicted. Management reaffirmed new verticals reaching gross profit positive in H2 2026. The Digital Shelf thesis isn’t wrong. It is understated, because it sits on top of a cost structure that is itself improving.
Then the silence. When Youssef Squali of Truist asked what drove the EBITDA outperformance, Ravi answered:
The unit economic improvement came in ahead of our expectations, specifically in a couple of areas. Ads was one of them, subtotal was the other one.
Twelve analysts asked questions. Not one, across MoffettNathanson, Evercore, Bernstein, JP Morgan, Morgan Stanley, Bank of America, Citi, Barclays, asked how large the advertising business is.
The advertising lever is not untouched. It is already contributing to results, Ravi said so. But it is under-disclosed. Instacart breaks out advertising separately and is valued on it. Uber discloses an advertising run-rate. DoorDash does neither, which means sell-side models assign marketplace economics to a revenue stream that likely carries much higher incremental margins. Companies segment-report when they want a business valued separately. SevenRooms venues growing 100%+ YoY, digital ordering at 150,000+ merchants with revenue up 40%+, reservations bookings up 150% sequentially, all described in prose, none tabulated.
The variant perception, stated carefully: the market appears to capitalize DoorDash’s current margin trajectory while assigning limited incremental value to a separately disclosed advertising or merchant-services segment. That segment is growing and already affecting EBITDA, but cannot be modelled from outside. The day DoorDash tabulates it, the sum-of-the-parts changes. That day hasn’t come.
The Ice Houses, Rebuilt
Two threads from the prior articles that Q2 resolved or materially advanced.
The Ice King assigned meaningful probability to a $1.5-2 billion Deliveroo impairment by 2027-2028. European food delivery had collectively destroyed $20 billion in shareholder value. Q2 showed the opposite. Deliveroo accelerated across MAUs, Total Orders, and subscription growth, all at two-year highs, while exceeding internal profit expectations and turning contribution profit positive. The global technology platform completes H1 2027; the efficiency benefits haven’t arrived yet. Management backed the thesis with capital: $1.05 billion of buybacks at roughly $154 average, the same buyback whose twelve-month absence I flagged in Q4 as a bear signal. That signal reversed.
Deliveroo has moved from probable problem to promising proof point. It has not yet been proven as a successful acquisition. DoorDash still does not disclose Deliveroo’s standalone EBITDA, cash contribution, integration spending, or return on purchase price. Contribution-profit positivity is evidence. It is not a return calculation.
The Ice King also posed the refrigeration question: would DoorDash’s infrastructure compound or be obsoleted? Justin Post of Bank of America asked about agentic AI traffic. Tony:
I think there’d be two big wars. One is the battle for attention, and you see that playing out with chat assistants. The other is the battle for atoms… Our focus is squarely on making sure that we master the physical world so we can be the most useful to all these digital assistants.
DoorDash isn’t waiting for the refrigerator. It’s building it, the Autonomous Delivery Platform orchestrating human dashers, Dot robots, DoorDash Air drones, and third-party AVs in a single routing system. Dot targeting a high single-digit percentage of Phoenix orders by year-end is the first falsifiable commitment. And Meituan’s 2025 experience, where JD.com and Alibaba destroyed sixty billion yuan of profit at full maturity, is a reminder that the cost curve, not pricing power, is the moat that survives competitive attack. DoorDash appears to be building the right one.
The Counterweight
The bears are not wrong about everything.
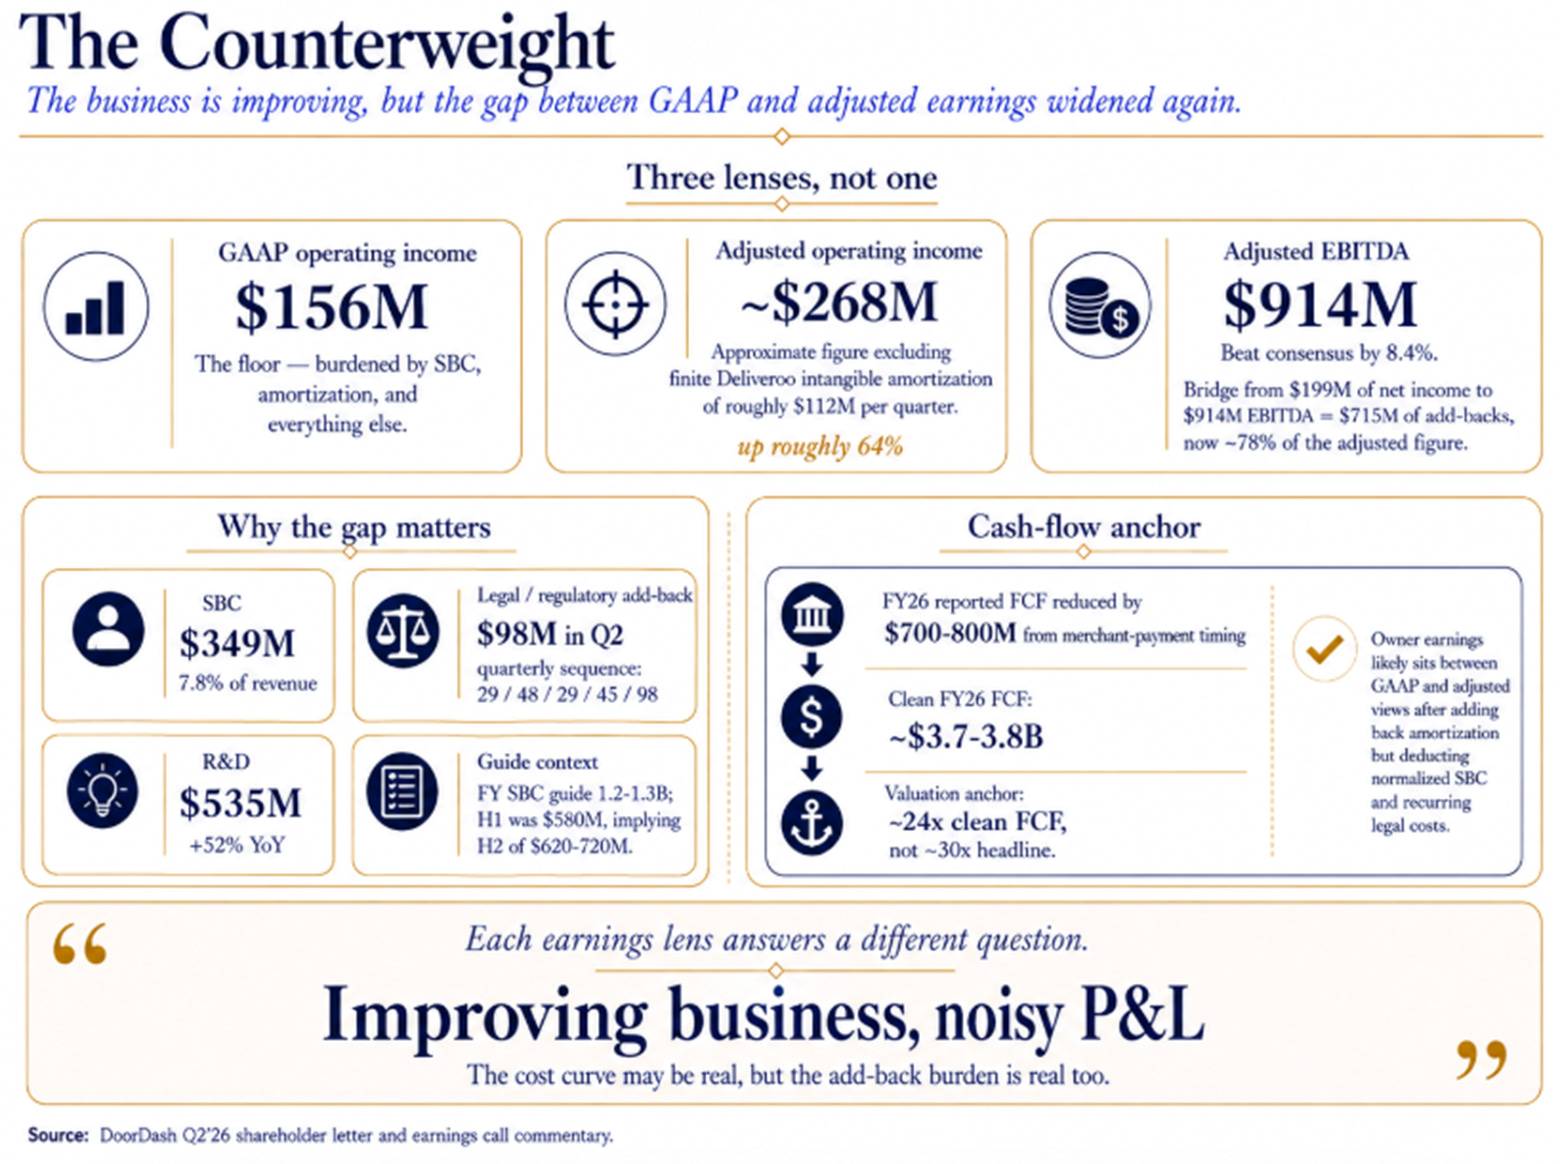
GAAP operating income declined 4.3% year-over-year on 36% revenue growth. The bridge from $199 million of net income to $914 million of EBITDA is $715 million, up 93% year-over-year, now 78% of the adjusted number.
Three items that need stating plainly. SBC was $349 million, 7.8% of revenue. Management “lowered” the FY guide to $1.2-1.3 billion, but H1 was $580 million, implying H2 of $620-720 million. Q2 is the run-rate, not the anomaly. The legal and regulatory add-back ran $29M, $48M, $29M, $45M, then $98M across five quarters. A charge excluded from EBITDA every quarter for years is an operating cost, and at $250-300M annualized it represents 7-8% of adjusted EBITDA. R&D grew 52% to $535 million, funding the technology platform and autonomous delivery.
Nobody on the call raised any of it.
The honest way to see this company’s earnings is through three lenses, not one. GAAP operating income was $156 million, the floor, burdened by acquisition amortization, SBC, and everything else. Adjusted operating income excluding the roughly $112 million per quarter of finite Deliveroo intangible amortization, which is non-cash and runs off on a defined schedule, but whose associated acquisition consideration was very real, was approximately $268 million, up roughly 64%. Owner earnings, after adding back the amortization but deducting normalized SBC and recurring legal costs, sits somewhere between these two. None of these views is more correct than the others. Each answers a different question.
On cash: management disclosed that FY26 reported free cash flow will be reduced $700-800 million by year-end merchant-payment timing. Clean FY26 FCF is therefore approximately $3.7-3.8 billion. The stock trades at roughly 24 times clean free cash flow, not the 30 times the headline implies. That is a useful anchor.
The GAAP-to-adjusted gap is real, and it widened this quarter. The cost curve argues it is transitional, the underlying business economics are improving even as the P&L carries acquisition and investment noise. But the gap is widening faster than the business is growing, and if the cost curve flattens while the add-backs persist, the adjusted story was always the generous one.
Three Worlds, 2029
The Q4 article’s base case was $175. The Q1 article’s was $210. FY2026 EBITDA is tracking approximately $3.73 billion, roughly matching the Q4 article’s 2027 base case. We are ahead of schedule on profitability. But the right response to being ahead of schedule is to revise the estimates, not to assume the rate continues.
A margin bridge makes the assumptions auditable:
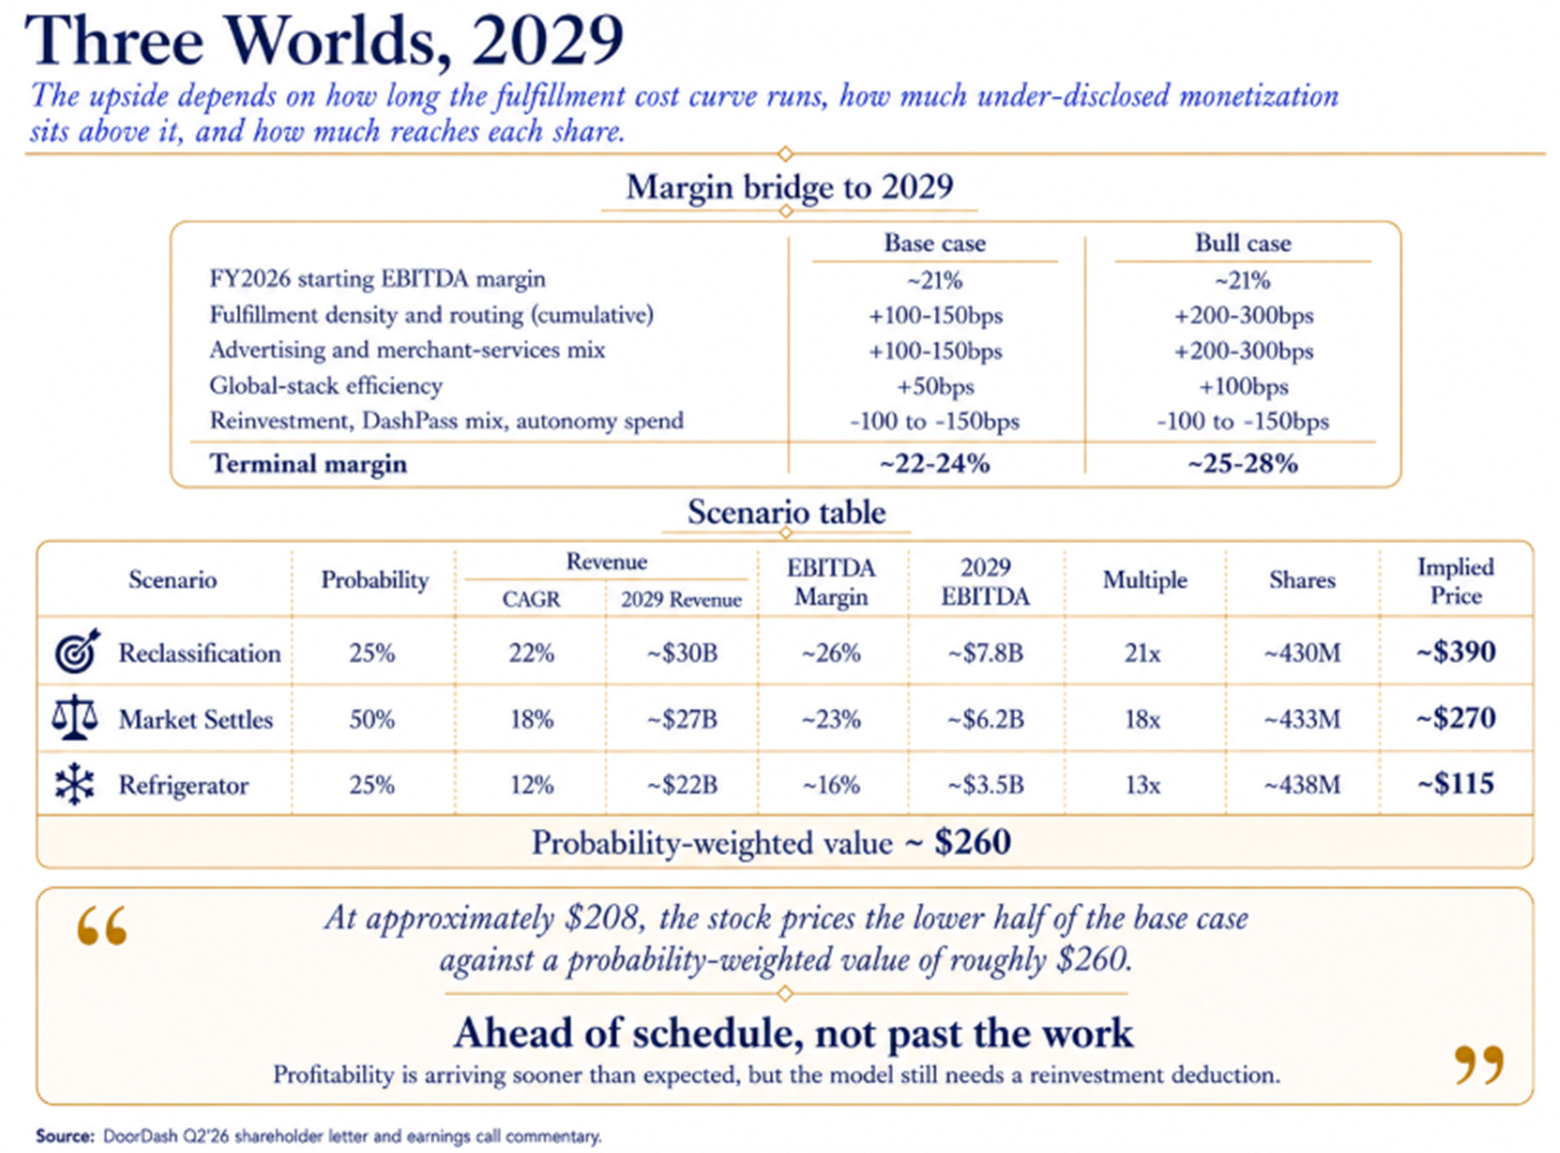
The reinvestment deduction is where intellectual honesty lives. DoorDash’s reward for proving one investment works is permission to begin three more. Management keeps finding attractive areas to fund, grocery infrastructure, autonomous delivery, merchant software, international expansion. The company may grow for longer than expected while converting less of that growth into per-share free cash flow than expected. That tension must be in the model, not outside it.
Share counts assume continued buyback at roughly the current pace (~$1.5B annually) partially offsetting SBC dilution of 8-10 million shares per year. Net cash of $8-12 billion by 2029 (varying by scenario) is added to the EV-to-equity bridge. These are approximations, not a full equity model, but the arithmetic is visible.
At approximately $208, the stock prices the lower half of the base case against a probability-weighted value of roughly $260. That gap is real but not extreme, roughly 25%, and the catalysts are defined: Q3 EBITDA in November, advertising disclosure at any point, and Deliveroo’s continued trajectory.
The updated BFQ. The prior articles asked whether DoorDash was a logistics company or a media company. That question has partially resolved. The new question: How long does the fulfillment cost curve run before it flattens, how much under-disclosed monetization remains above it, and how much of both reaches each share rather than funding the next layer of expansion?
The first two parts are bullish inputs. The third is the constraint that keeps this from being a simple call.
The variant stated carefully. Consensus sees a delivery company in an investment cycle that will eventually produce margin expansion. The variant: the margin expansion has already begun in the cost curve, and the monetization layer, advertising, grocery commercial terms, merchant services, is under-disclosed and only partly exercised. The market is pricing the margin DoorDash has earned. The less visible question is how much additional margin exists that DoorDash has not yet chosen to show.
What Resolves This
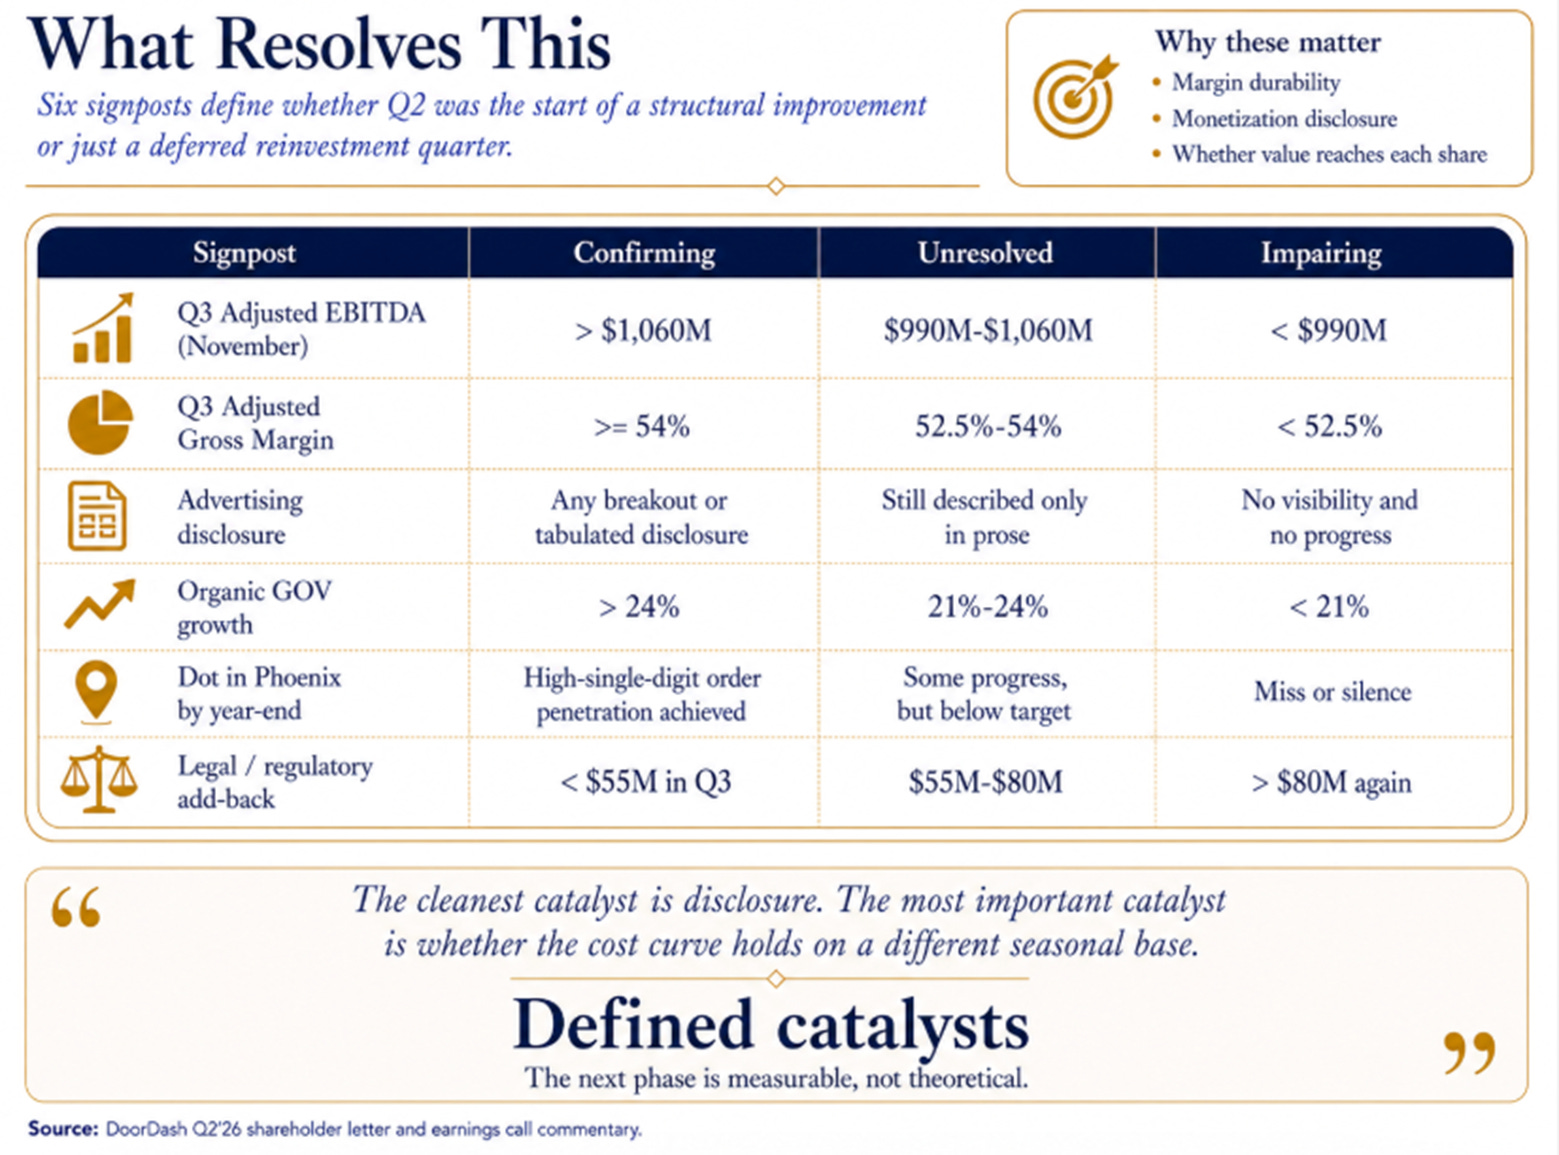
Six signposts, each with a threshold.
Q3 Adjusted EBITDA (November). Above $1,060M strengthens the case that Q2’s improvement was structural. Below $990M suggests it was timing and reinvestment deferral.
Q3 Adjusted Gross Margin. At or above 54% means the year-over-year expansion holds on a different seasonal base. Below 52.5% means the curve may have flattened or Q2 was mix-driven.
Advertising disclosure. Any quarter, any format. The single cleanest re-rating catalyst, the moment the second business becomes defensible in numbers rather than prose.
Organic GOV growth. Above 24% reverses the Q1-to-Q2 deceleration. Below 21% compresses the multiple regardless of margin.
Dot in Phoenix by year-end. Hit means the autonomy R&D is a funded option with observable progress. Miss or silence means discount the autonomous delivery narrative.
Legal/regulatory add-back. Below $55M in Q3 means the $98M was discrete. Above $80M again means treating it as a permanent operating cost and haircutting EBITDA accordingly.
The ice houses are still useful. Q2 showed us something the prior articles didn’t expect: the ice is getting cheaper to cut even before Tudor raises the price. The DashPass flywheel is filling the shelves. The advertising layer is contributing before being disclosed. Deliveroo is improving before the platform rebuild is complete.
The compounding mechanism appears real. The remaining question, the one that keeps this from being a simple buy, is how much of that compounding reaches each share, and how much funds the next ambition management decides to pursue. DoorDash has begun proving the network generates more value as it grows. It has not yet proved how much of that value it intends to keep
Disclaimer:
The content does not constitute any kind of investment or financial advice. Kindly reach out to your advisor for any investment-related advice. Please refer to the tab “Legal | Disclaimer” to read the complete disclaimer.