


TL; DR
The near-term operating story has improved materially: revenue rose 29%, free-cash-flow conversion recovered to 83%, and December guidance points to another sharp step-up as optical supply constraints ease. What looked like sequencing was partly a capacity-planning problem.
But the structural thesis is more demanding than a bigger WFE market: KLA’s 2030 framework assumes its share of wafer-fab equipment spending rises from roughly 7.5% toward 9%. The industry has advanced faster than expected; KLA now has to prove that inspection content per fab rises too.
That matters because the stock is not priced for obvious failure: at current levels, consensus earnings are already broadly embedded. The variant is not simply “WFE is strong,” but that process-control content, margins and cash conversion outperform already elevated expectations.
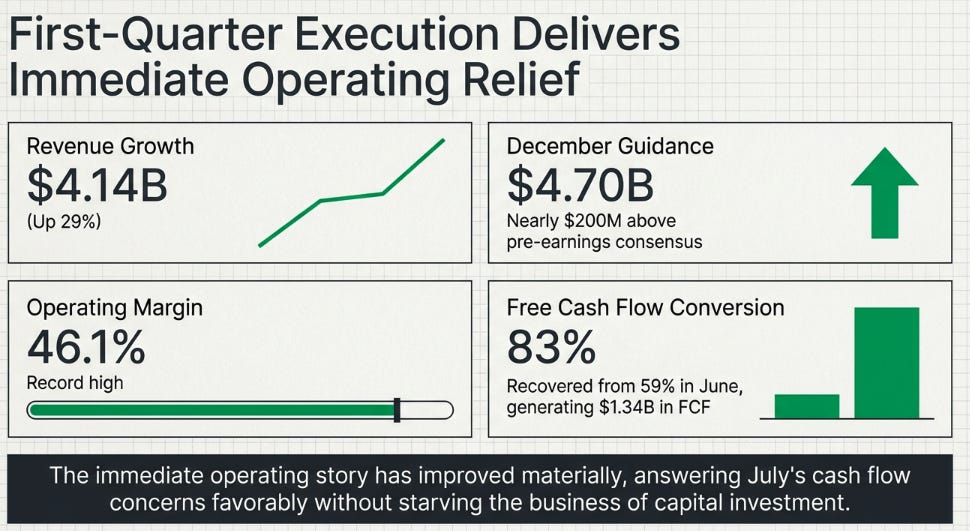
In July’s The Market Arrived First, I wrote that KLA’s structural thesis was advancing while the stock was running ahead of the financial evidence. The most uncomfortable number was free-cash-flow conversion: just 59% in June. September brought that back to 83%, revenue rose 29% to $4.14 billion, and management guided December revenue to $4.70 billion, nearly $200 million above the pre-earnings consensus.
It also demands harder questions.
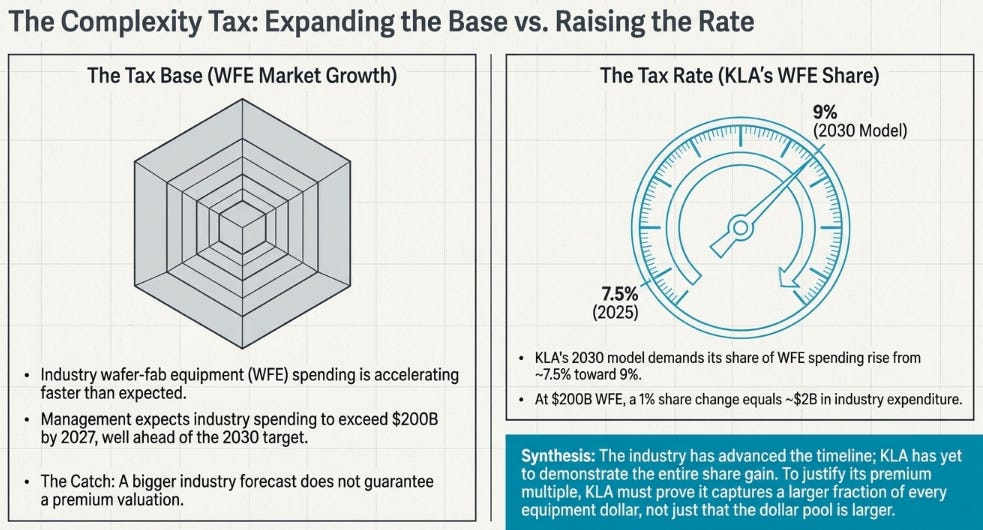
KLA’s 2030 model assumes that its share of overall wafer-fab equipment spending rises from about 7.5% in 2025 toward 9%. Meanwhile, the wafer-equipment market itself is growing much faster than management expected. The industry has advanced the model; KLA has yet to demonstrate the entire share gain. That is the investment question now: can KLA turn a bigger market into a bigger claim on each equipment dollar, or is the complexity tax still mostly a metaphor for a good cycle?
We mistook the constraint
Our May article offered a plausible explanation for why Lam Research and Applied Materials were growing faster than KLA: the builder arrives before the inspector. First fabs need capacity; later they need to make that capacity yield. In July, I argued that the market had capitalized the eventual handoff before KLA’s cash flows arrived.
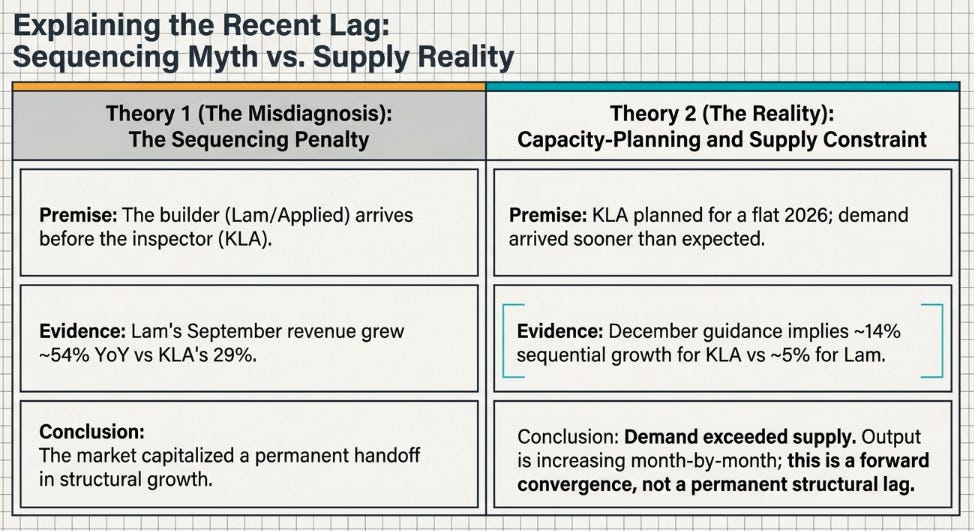
The October call complicates that story. CFO Bren Higgins said the weak first half of 2026 was not principally about business mix, but KLA’s ability to supply its customers. CEO Rick Wallace said KLA had planned for a relatively flat 2026, only to discover that demand was arriving sooner than expected. What I called sequencing was partly a capacity-planning error.
The bottleneck is specialized optics. Tool lead times average roughly twelve months; certain advanced inspection platforms take longer. KLA has spent a year expanding critical supplier output, and that output is now increasing month by month. Management still says demand exceeds supply. It has not become unconstrained; it is better positioned to deliver against commitments it could not previously fulfill.
The financial evidence fits. Wafer-inspection systems revenue rose 37% year over year to $2.11 billion in September, versus approximately 1% growth in June. Wafer inspection accounted for roughly $330 million of the quarter’s $478 million sequential increase in consolidated revenue. KLA’s biggest product category, not just its smaller patterning business is accelerating.
Lam’s September revenue still grew approximately 54% year over year, against KLA’s 29%. The builder has hardly surrendered the lead. But Lam’s December guidance implies about 5% sequential growth, while KLA’s implies nearly 14%. This is an encouraging forward convergence, not proof of a permanent handoff. Equipment mix and shipment timing complicate comparisons.
Customers do not need to discover inspection; some demand already exists. What remains to be established is how much of the growing backlog reflects a lasting increase in inspection content rather than shipments that were simply delayed.
The market is bigger. Is KLA’s share?
KLA’s March Investor Day envisioned approximately $26 billion of revenue and $8.40 of split-adjusted earnings per share by 2030, supported by wafer-equipment spending around $220 billion, plus or minus $20 billion. KLA now expects industry spending to exceed $200 billion in 2027. During the call, Wallace said the assumptions behind the 2030 model would be exceeded before the target year.
Bernstein’s Stacy Rasgon asked the obvious question: why should the 2030 revenue target not arrive in 2027? Higgins identified what the industry forecast leaves out. KLA has not yet reached its targeted overall equipment-market share; its services business needs years of installed-base growth, and businesses outside core process control have their own trajectory. Industry spending can arrive early without every part of KLA’s financial model arriving alongside it.
UBS’s Tim Arcuri framed the tension more pointedly, describing KLA as having lost roughly 20 basis points of WFE share in 2026. That was an analyst characterization, not a published company measurement, and Higgins did not independently quantify the figure. Still, he directly committed to the direction: KLA expects to outgrow WFE in 2027.
That is the distinction worth underwriting. At $200 billion of equipment spending, a one-percentage-point change in market participation represents approximately $2 billion of industry expenditure before differences in definitions, timing and revenue recognition. The scale explains why share gains matter more than another industry forecast increase.
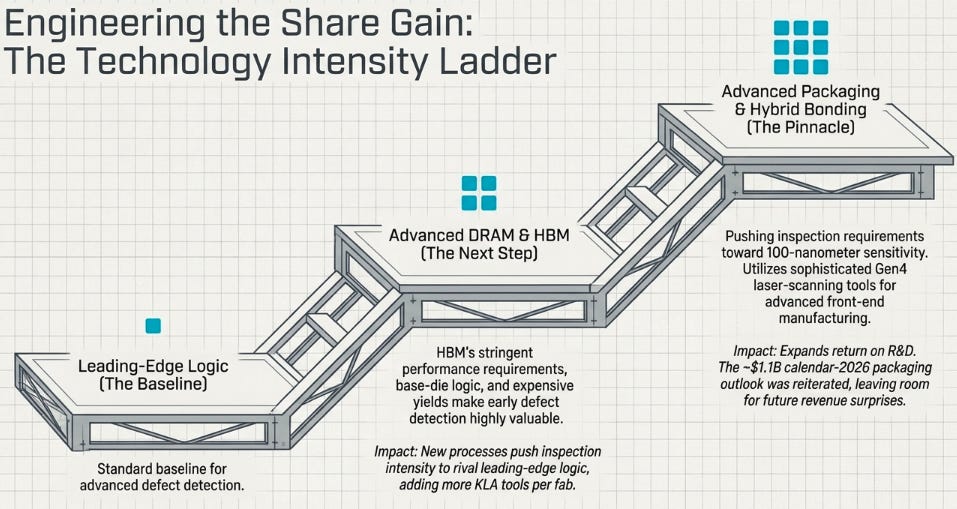
The technical evidence is promising. Management says some advanced DRAM applications now require inspection intensity comparable to leading-edge logic. HBM’s stringent performance requirements, base-die logic, reduced redundancy and expensive yields make earlier defect detection more valuable. New DRAM fabs add equipment volume; more demanding processes could add KLA tools per fab.
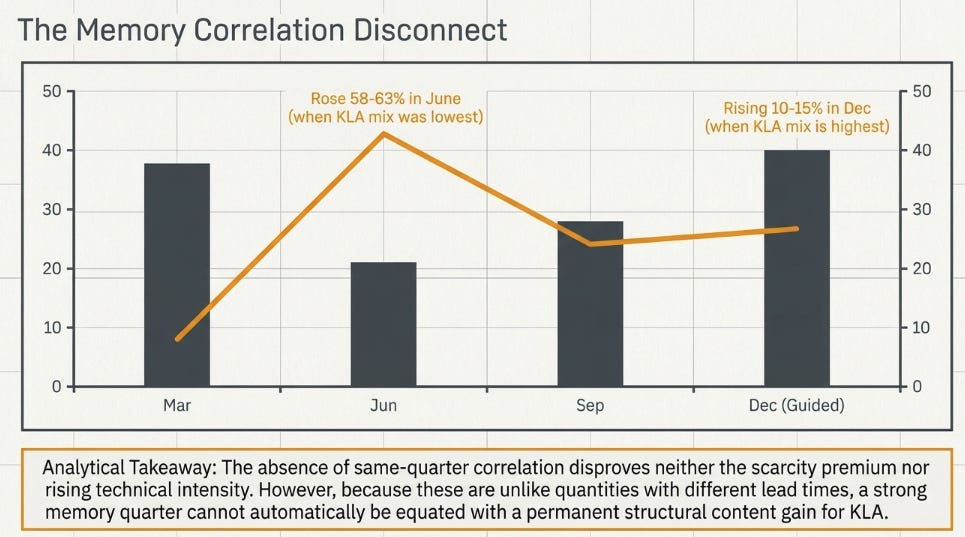
But this cannot be inferred from quarterly memory mix alone. Memory represented 38% of semiconductor process-control systems sales to semiconductor customers in March, 21% in June, 28% in September and is guided at 40% in December. Conventional DRAM contract prices were forecast by TrendForce to rise 58–63% in the June quarter, when KLA’s memory mix was lowest; they are forecast to rise 10–15% in December, when its mix is highest. These are unlike quantities with different lead times, so the absence of same-quarter correlation disproves neither the scarcity premium nor rising technical intensity. It does show why a strong memory quarter cannot be equated with a permanent content gain.
Advanced packaging supplies the more distinctive possibility. Hybrid bonding is pushing certain inspection requirements toward 100-nanometer sensitivity. KLA is selling more sophisticated laser-scanning tools and even some Gen4 inspection into packaging, reusing technologies developed for advanced front-end manufacturing. The customer is moving into a problem KLA already knows how to solve. That expands the economic return on accumulated R&D and qualification expertise. Its approximately $1.1 billion calendar-2026 packaging outlook, however, was reiterated rather than increased; higher technical ambition is not yet evidence of a new revenue surprise.
The moat is difficult inspection physics, production learning, qualified tools, engineering integration and services, not a consumer-style network effect. Those advantages become more useful as device complexity rises, but KLA must demonstrate that they translate into a larger fraction of industry spending.
The reported quarter conceals two different cycles
September’s numbers are impressive, but their composition matters.
The first complication is geography. China represented 34% of September revenue, approximately $1.41 billion, versus about $967 million in June. On rounded disclosures, that increase accounts for roughly 90% of KLA’s entire sequential revenue gain. This does not mean the wafer-inspection acceleration was driven by China: KLA does not provide the product-by-country cross-tab needed to establish that. But it does mean we should not describe September as though all incremental revenue came from leading-edge foundry deployments outside China.
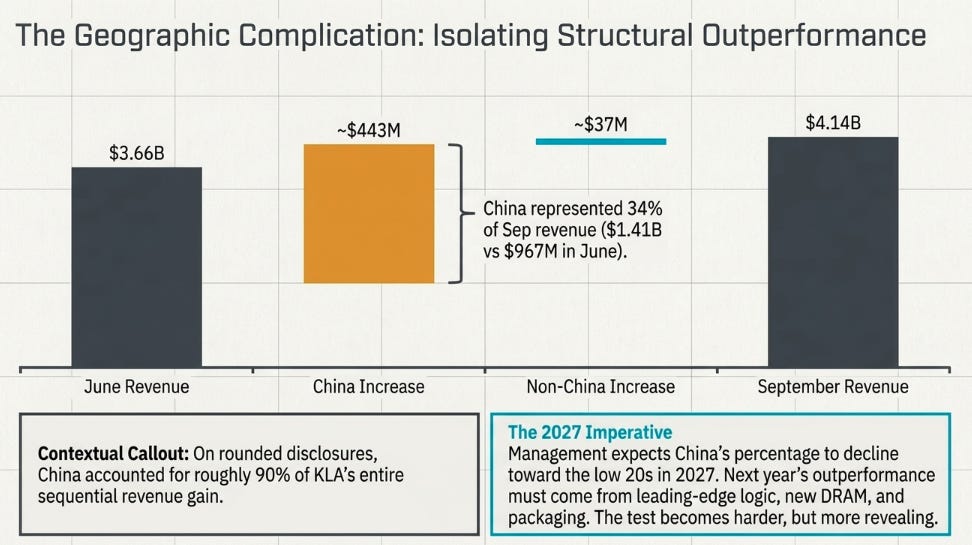
Management expects China’s percentage to decline toward the low 20s in 2027, even as absolute China sales may grow modestly. If that happens, next year’s outperformance must come from the promised leading-edge logic, new DRAM facilities and packaging demand. This makes the test more revealing, not easier.
The second complication is profitability. The same DRAM scarcity that raises the value of yield for memory makers raises the cost of DRAM inside KLA’s image-processing systems. KLA cannot readily reprice fixed-price backlog. It expects new product agreements and engineering changes that use less memory to improve gross margin later in 2027 and into 2028. Fast-growing packaging and adjacent businesses may also dilute the consolidated gross-margin percentage.
There is a potential partial offset in a future memory downturn: falling DRAM prices could reduce KLA’s system costs just as memory makers cut equipment spending. But the sizes and timing are not disclosed; calling this quantified earnings hedge would be false precision.
For now, volume is doing the work. September operating margin reached a record 46.1%, and December guidance implies approximately 47.4%, even with gross margin broadly flat. That is why the timing matters: supply-led revenue growth is arriving first; better product pricing and memory efficiency may improve profit conversion later. Services, $851 million in September, up 14%, should benefit as more systems enter the installed base, although hardware is presently growing faster.
Cash offers a more tangible improvement. KLA produced $1.34 billion of free cash flow while inventory consumed $434 million of operating cash and capital expenditures reached $195 million. The recovery from June’s 59% cash conversion therefore did not depend on starving the business of investment. It answers our July concern favorably, though one quarter cannot establish the working-capital cost of the entire expansion.
The stock is not priced for failure
One tempting valuation argument is that at $158.77 before earnings and a 25-times terminal P/E, KLA’s price implied just $6.35 of FY29 EPS, about a quarter below consensus. That arithmetic divides today’s price by a future multiple but omits the return investors require while waiting for FY29.
At a 10% annual required return over three years, $158.77 today at 25-times future earnings implies about $8.45 of FY29 EPS. Updated consensus as of October 29 is approximately $8.47, alongside FY29 revenue of $26.05 billion. On those assumptions, the price was broadly consistent with consensus being achieved, not with a 25% earnings collapse. Around $165 after hours, the same hurdle requires roughly $8.78 of FY29 EPS. Dividends and different multiples change the result, but the point holds: the stock is not demonstrably priced for failure.
Our variant must therefore be specific. Better shipment conversion and rising process-control content may push FY29 earnings above an already ambitious consensus. Greater confidence in those earnings may also sustain KLA’s premium multiple. Neither proposition is free. Our central $9.05 EPS estimate is only about 7% above the newly revised FY29 consensus.
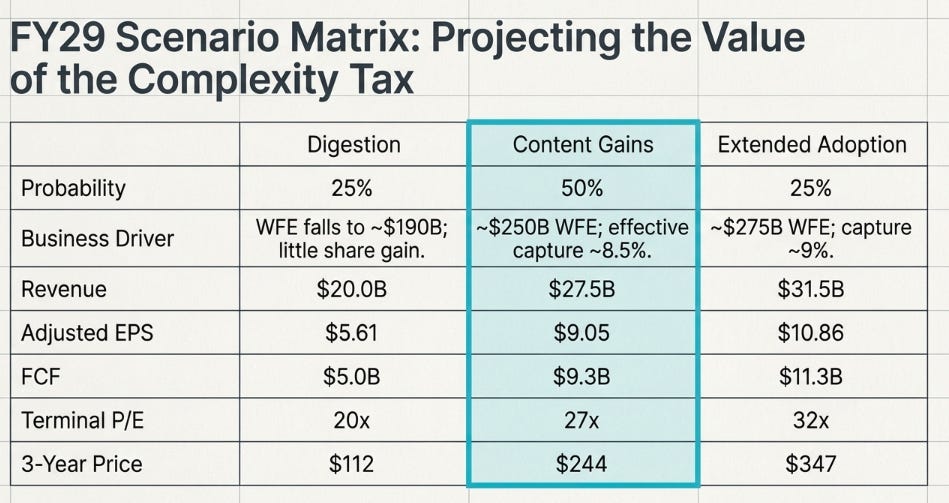
The next tests are straightforward: December shipments must support the $4.70 billion guide; the subsequent quarter should preserve sequential growth; KLA’s comparable process-control systems growth should exceed WFE during 2027 and remain strong after the supply catch-up; gross margin should move toward 63–64% as pricing and product redesign take effect; and trailing cash conversion should remain close to 80%. China and fab-readiness timing need to be reconciled rather than used as permanent excuses.
In April, we identified the complexity tax. In May, we tried to explain when it would be collected. In July, we learned that the stock market had anticipated the collection. October shows KLA finally shipping more equipment and generating more cash, but a larger tax base is not the same as a higher tax rate.
2027 is when KLA must demonstrate the difference.
$KLA
Disclaimer:
The content does not constitute any kind of investment or financial advice. Kindly reach out to your advisor for any investment-related advice. Please refer to the tab “Legal | Disclaimer” to read the complete disclaimer.