


TL;DR
Lam cleared nearly every test we set far earlier than expected: gross margin reached 52%, NAND doubled to 23% of systems revenue, and CSBG rose to $2.47 billion.
The structural thesis is now stronger: more three-dimensional and technically demanding chips require more etch, deposition, and service intensity per wafer—but the spending that expresses that complexity remains cyclical.
The old bear case was China and margin compression. The new one is that customers are compressing several years of investment into a short window, creating a future capacity digestion cycle that Lam has not yet proved it can compound through.
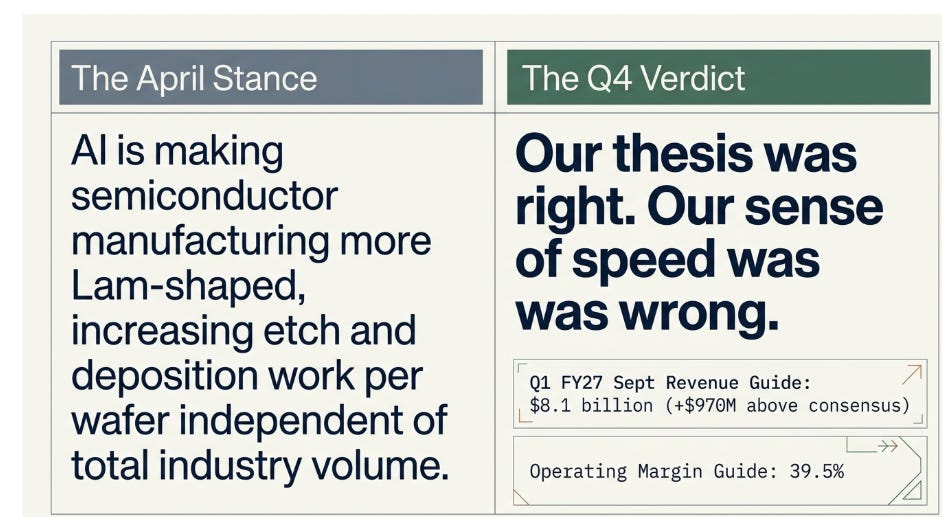
In April, at $275, I argued that AI was making semiconductor manufacturing more Lam-shaped, increasing the etch and deposition work required per wafer, independent of how many wafers the industry processes. I set four signposts. Gross margin above 50%: proves the operational flywheel. NAND above 15% of systems revenue: proves the conversion pull-forward is real. CSBG above $2 billion: proves the installed-base compounding is structural. CY27 WFE above $155 billion: proves the multi-year cycle extends.
I expected those tests to take time.
Lam cleared almost all of them in one quarter. Gross margin hit 52%, a 20-year high. NAND hit 23% of systems. Doubled. CSBG jumped to $2.47 billion. WFE was raised to “the low $150 billion range” for 2026, with 2027 described as an “extraordinary setup.” Then Lam guided September revenue to $8.1 billion, $970 million above consensus, with a 39.5% operating margin.
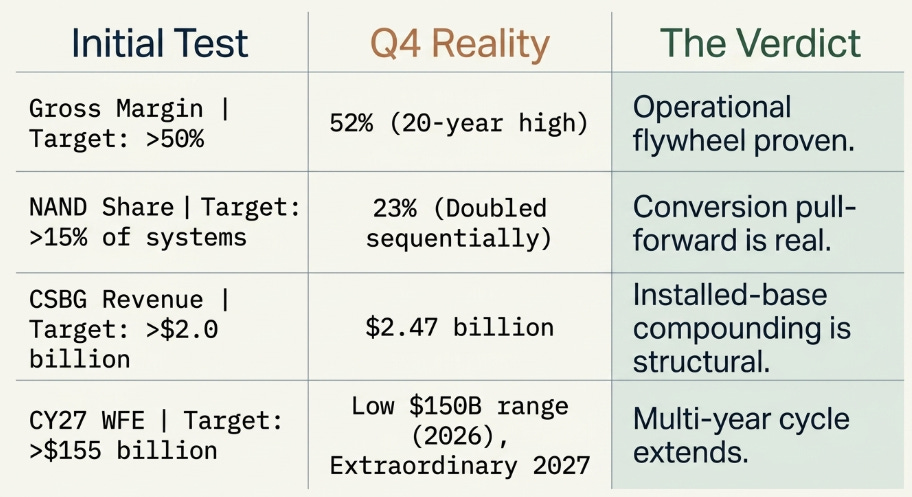
Our thesis was right. Our sense of speed was wrong.
One correction. In January I modeled a 48–49% gross margin floor after China declined. The actual number is 52%, and management is targeting mid-50s. I was wrong by 300 basis points. The R&D maturity flywheel I described in April was real, but I underestimated both its magnitude and the pricing contribution that comes from solving the hardest manufacturing problems at the most advanced nodes.
And one prior debate that can be closed. China fell from 34% to 26% of revenue. Lam posted record margins and a massive guide. The old thesis, that declining China revenue would compress margins, has not merely weakened. It has been falsified.
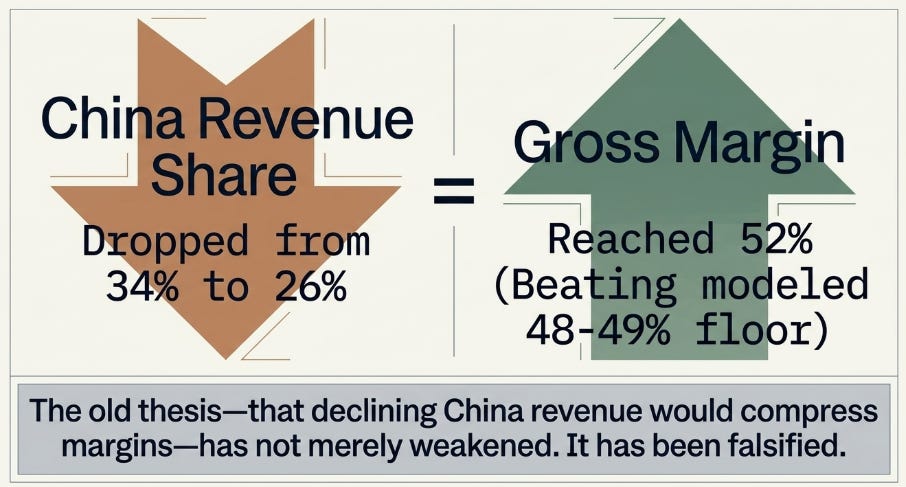
The question in April was whether AI was making semiconductor manufacturing more Lam-shaped. June answered it. The better question now: can rising semiconductor complexity increase Lam’s content per wafer fast enough to outrun the capacity cycle that its own success is helping create?
The same problem, spreading
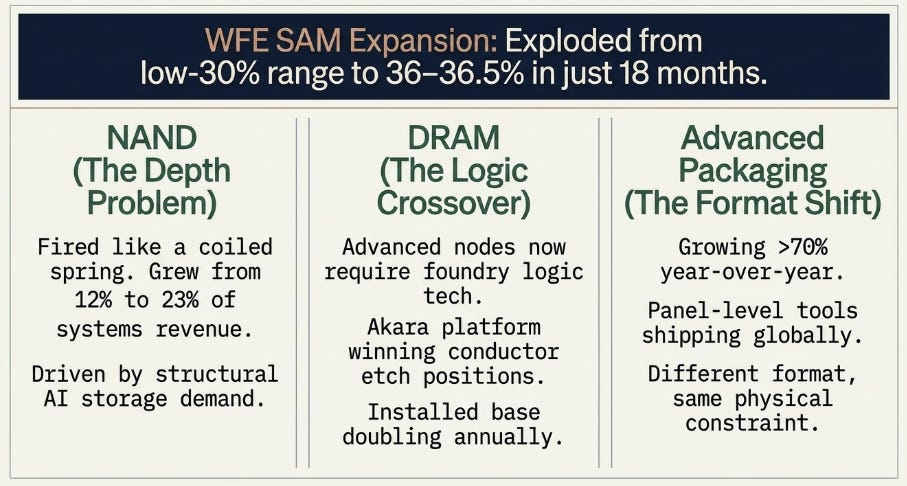
Lam’s served available market reached roughly 36–36.5% of WFE, ahead of the timeline set at the 2025 Investor Day. Doug Bettinger, when Mizuho’s Vijay Rakesh asked:
“We at that point were talking about our SAM expanding from the low 30% of WFE range into the high 30% range. As we sit here today, we’re probably trending already to that high level. We’re, I don’t know, I’d guess 36%, 36.5% this year.”
Low-30s to 36.5% in 18 months. That doesn’t mean Lam invented a new market. It means more semiconductor spending is flowing toward etch, deposition, and surface treatment where Lam is already strong. The same technical problem, building three-dimensional structures with tighter geometries, is spreading across device categories.
In NAND, the problem is depth. In January I called it the coiled spring. This quarter it fired. NAND went from 12% to 23% of systems revenue, more than doubling sequentially. Tim Archer framed it as structural AI demand:
“Expanding context windows and persistent memory requirements are driving significantly higher demand for flash storage.”
That completes a narrative shift SK Hynix started in January. If NAND spending is genuinely AI-driven, the historical cyclical discount investors apply is wrong.
But I want to note how Archer handled the pushback. When Citi’s Atif Malik raised TrendForce forecasts of NAND oversupply in 2027, Archer didn’t defend NAND directly. He widened the lens, “the Lam story is a lot bigger than just NAND.” A fully confident defense would have met the oversupply question head-on. He redirected instead. The structural reframing is still the right emphasis, but when management deflects rather than defends, I want to register that.
The air pocket risk from April, what fills the revenue stream when the $40 billion conversion completes?, has not been answered, only deferred. Whether conversion hands off to greenfield capacity or enterprise SSD demand sustains the build is what the next articles need to track.
The same physical constraint is appearing in DRAM, where advanced nodes now require technologies first proven in foundry logic. Lam’s Akara platform, adopted for GAA logic at 2nm, is winning conductor etch positions in DRAM, its installed base doubling annually. Advanced packaging is growing more than 70% year-over-year, with panel-level tools shipping across multiple geographies.
Different device. Different format. Same physical problem.
The 52% gross margin confirms the mechanism is financial, not just technical. The toll rate rises, more process steps per wafer, and the collection cost falls: more mature tools, closer-to-customer manufacturing, scale leverage. Pricing contributed, but management didn’t quantify the component, so I can’t cleanly separate it from mix and efficiency gains. The prior articles correctly identified customer concentration as a margin constraint, and TSMC, Samsung, and SK Hynix remain formidable procurement organizations.
Management raised long-term targets to mid-50s gross margins and mid-40s operating margins, a material upgrade from the 2025 Investor Day framework. Several quarters need to pass before declaring 52% the permanent floor rather than a favorable mix quarter.
The installed base earns its keep, and the balance sheet absorbs the strain
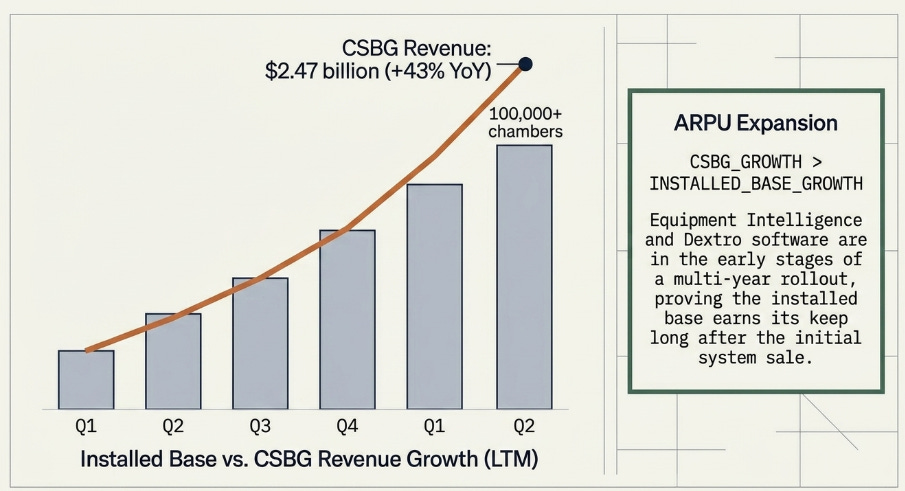
CSBG at $2.47 billion, up 43% year-over-year, is the compounding layer from April made visible at scale. Bettinger confirmed it’s “growing faster than the installed base.” That’s ARPU expansion. Equipment Intelligence and Dextro are in “the very early stages of a multi-year rollout” across 100,000+ chambers.
Here’s the tension. The Q4 upside came entirely from CSBG. Systems revenue of $4.25 billion missed consensus by $177 million. If complexity means more tools per wafer, systems should accelerate too.
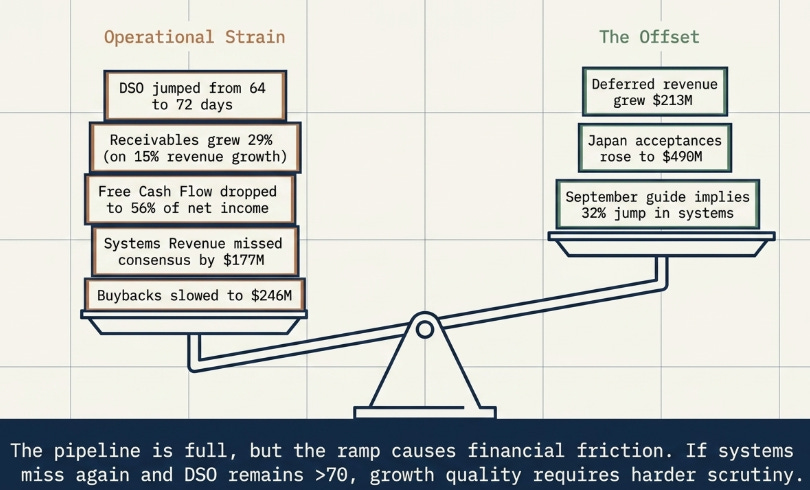
And the ramp’s financial strain shows. DSO jumped from 64 to 72 days. Receivables grew 29% on 15% revenue growth. Free cash flow was 56% of adjusted net income. Buybacks slowed to $246 million from $796 million. Headcount rose roughly 1,800 in one quarter.
The systems miss is probably timing, the $8.1 billion September guide implies ~$5.6 billion in systems, a 32% sequential jump. Deferred revenue grew $213 million. Japan acceptances rose to $490 million. The tools are in the pipeline.
One quarter of this mismatch is timing. If systems miss again in September and DSO stays above 70, the quality of the growth deserves harder scrutiny.
Success creates the next bear case
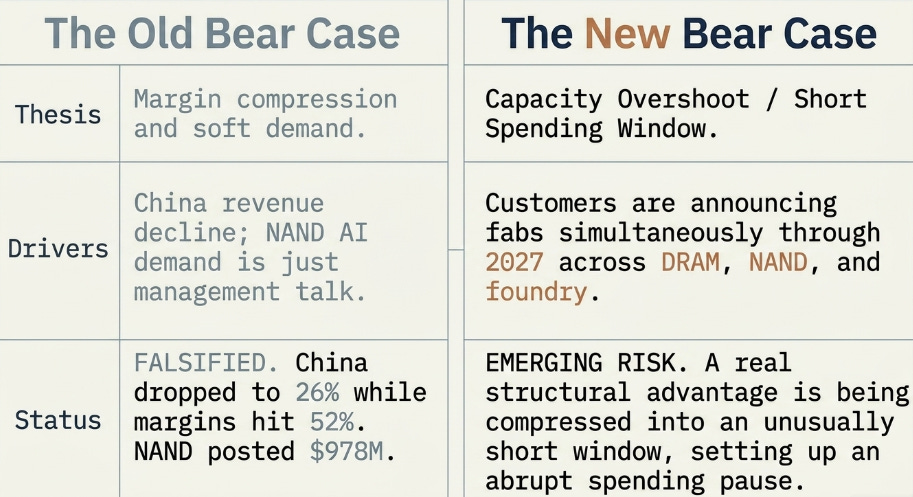
The old bear cases have weakened. China-margin compression: falsified. NAND as management talk: $978 million says otherwise. The 50% margin needing China: disproved at 52% with China at 26%.
The new bear case is that a real structural advantage is being compressed into an unusually short spending window. Customers have announced fabs through 2027 and beyond. DRAM, NAND, foundry logic, and packaging are all rising together. That is excellent for orders. It also creates the conditions for excess capacity when those fabs produce simultaneously.
The right distinction, and the one I collapsed too easily in prior versions, is between complexity as a persistent technical direction and spending on complexity as a cyclical financial expression. Complexity may never peak. The rate at which customers spend to address it absolutely can.
What the market prices and what it doesn’t
At what point does our variant perception become consensus?
At $298, with analysts raising targets to $350–$450 and the structural narrative spreading, the qualitative thesis is no longer ours alone.
It’s also worth recognizing that management is actively selling the re-rating. Every disclosure choice, SAM quantified at 36.5%, advanced packaging upgraded to >70%, new profitability targets at peak performance, “compelling” escalated to “extraordinary”, serves one purpose: convince long-only capital that Lam deserves a compounder multiple. That doesn’t make it wrong. During an upcycle, authenticated structural shifts and peak-cycle management confidence produce identical signals. They separate when the cycle turns.
The narrative has shifted. The numbers have not. FY27 consensus at $31.1 billion and $8.20 EPS is difficult to sustain after a $8.1 billion quarterly guide. Estimates need to move materially higher. The revision cycle should provide a mechanical tailwind over the next 60–90 days.
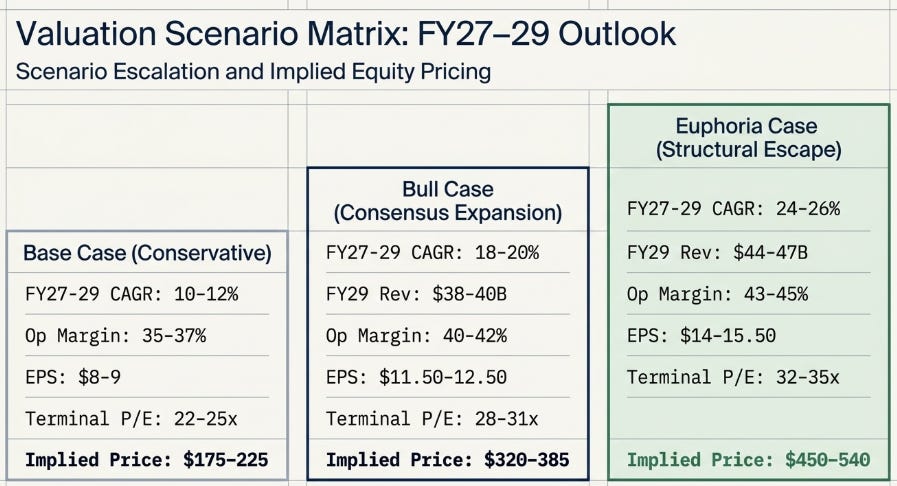
The bear case is not catastrophe. It’s the possibility that the physical thesis proves correct while the financial expression proves cyclical, customers compress spending into FY27, capacity overshoots, and rising content per wafer does not fully offset the decline. Lam exits as a better business. Just not one that has escaped cyclical valuation.
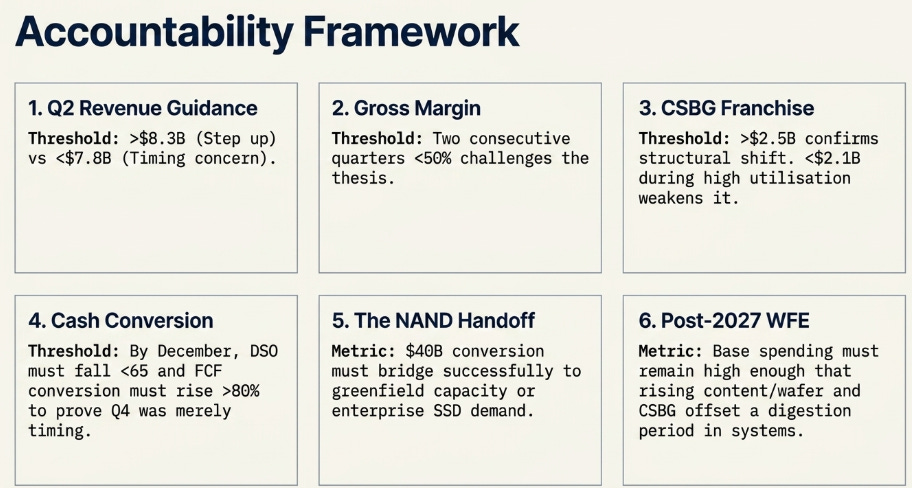
Six signposts:
December revenue guidance. Above $8.3B = September was a step. Below $7.8B = timing concern.
Gross margin. Below 50% for two consecutive quarters challenges the thesis.
CSBG. Above $2.5B confirms the franchise. Below $2.1B during high utilization weakens it.
Cash conversion. DSO below 65 and FCF conversion above 80% by December = June was timing.
The NAND handoff. Conversion must bridge to greenfield or sustained enterprise SSD demand.
WFE after 2027. Spending must stay high enough that content and CSBG offset systems digestion.
The toll booth metaphor has served its purpose across four articles. What this quarter showed is that it compounds: the toll rate rises with complexity, the collection cost falls with scale, and every tool enlarges an installed base that generates rising revenue for years.
Management is selling the conclusion, Lam compounds through cycles, before the test arrives. The test arrives when the fabs being built today begin producing simultaneously and equipment orders decelerate. Until then, the structural narrative and the cyclical data will be indistinguishable.
The mechanism is real. I believe that more than I did in January, more than I did in April, and more than the evidence strictly requires me to. What I do not yet have is evidence that it survives a spending pause. That evidence cannot exist until the pause arrives.
This quarter proved Lam captures more when customers spend. The next cycle will show how much persists when they stop.
Disclaimer:
The content does not constitute any kind of investment or financial advice. Kindly reach out to your advisor for any investment-related advice. Please refer to the tab “Legal | Disclaimer” to read the complete disclaimer.