SMIC Q3 2025: The Ceiling Reveals Itself
Record utilization, rising revenue, and a margin ceiling that won’t break. SMIC’s Q3 wasn’t a triumph—it was a revelation of constraint.
TL;DR:
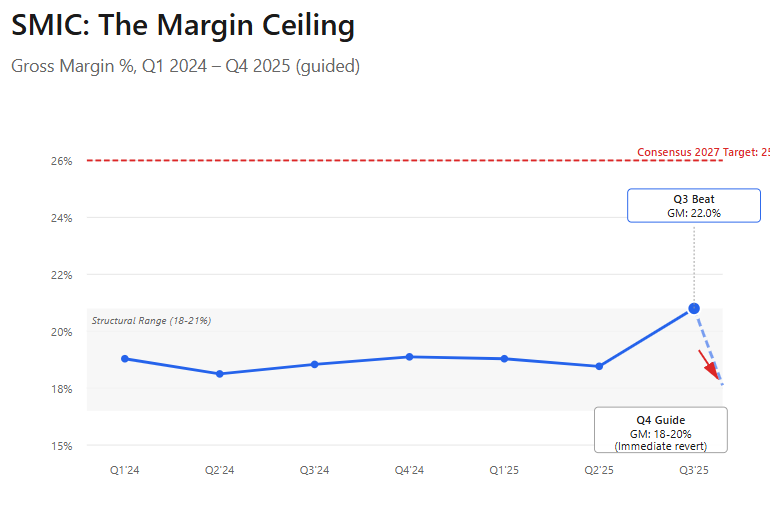
The Margin Ceiling Is Real: Even with 95.8% fab utilization and favorable mix, SMIC’s gross margin maxed at 22%—then was guided straight back down to 18–20%. That’s not conservatism; it’s physics.
Capex as a Trap, Not a Growth Lever: With $2.4B in Q3 capex—roughly equal to revenue—depreciation now consumes over 40% of sales. Scale only deepens the drag.
Structural Limits, Structural Mispricing: Investors are paying a triple-digit P/E for a state-mandated utility masquerading as a growth stock. The Q3 beat confirmed the constraint, not the upside.
Semiconductor Manufacturing International Corporation reported third quarter results that, on their face, looked impressive. Revenue grew 7.8% QoQ to $2.38 billion. Gross margins expanded to 22.0%, well above the company’s 18-20% guidance range. Utilization rates climbed to 95.8%, suggesting robust demand. The stock initially rallied.
Then came the fourth quarter guidance: revenue flat to up 2%, gross margins back to 18-20%.
This wasn’t management sandbagging. This was management telling investors exactly what SMIC is—and what it can never be. The 48 hours between the Q3 beat and Q4 guide-down matter more than any single quarterly result, because they reveal the governing physics of SMIC’s business model. Or more precisely, they confirm it isn’t a business model at all.
The Margin Ceiling in Practice
SMIC’s Q3 depreciation and amortization totaled $996 million against $2.38 billion in revenue—41.8% of sales consumed before any other costs. This isn’t an accounting quirk. It’s the mathematical expression of SMIC’s capital intensity meeting its mission constraints.
The company spent $2.39 billion on capital expenditures in the quarter, essentially matching its quarterly revenue. Over the trailing twelve months, capex has exceeded $7 billion while revenue runs at roughly $9.5 billion annually. No commercial semiconductor company operates this way. TSMC’s capex-to-revenue ratio runs around 40-50% in heavy investment years; SMIC’s consistently exceeds 70-80%.
This capital deployment creates a depreciation wave that rolls forward indefinitely. Each billion dollars in equipment purchases generates $140-200 million in annual depreciation over the asset’s useful life. As SMIC layers on $7 billion annually, the depreciation base compounds. The result is a structural ceiling on gross margins that has nothing to do with operational efficiency or market conditions.
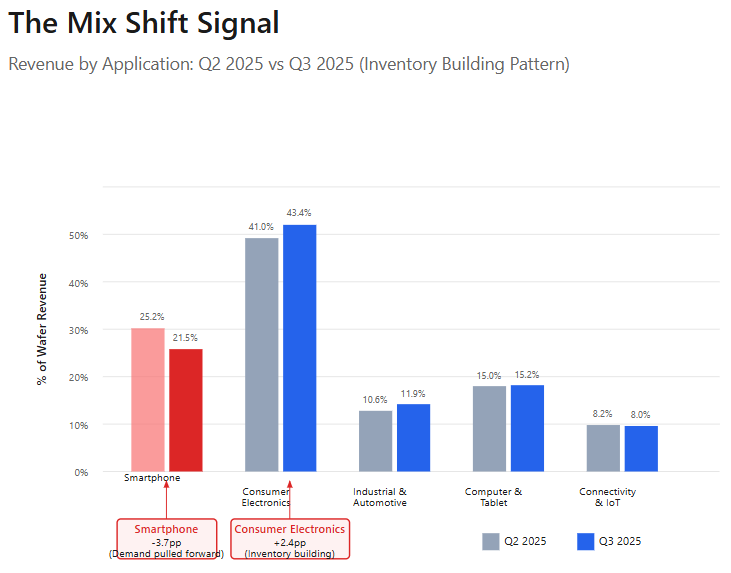
When SMIC’s gross margin spiked to 22% in Q3, it wasn’t because the company had suddenly improved its cost structure or pricing power. It was a function of utilization (95.8%) and product mix—consumer electronics jumped to 43.4% of revenue from 41% the prior quarter, while smartphone revenue fell from 25.2% to 21.5%. Management immediately guided Q4 back to 18-20% not because they expect a cyclical downturn, but because they see this mix shift reversing.
The margin band isn’t a target. It’s a constraint.
Borrowed Time
The utilization story tells the same tale. At 95.8%, SMIC’s fabs are essentially at capacity. Yet management guided fourth quarter revenue to flat or up just 2%. This divergence—peak utilization with minimal sequential revenue growth—should raise questions about demand durability.
The product mix shifts in Q3 provide the answer. Consumer electronics surging while smartphones decline isn’t end-market strength; it’s inventory building. Chinese electronics manufacturers, facing tariff uncertainties and potential export control tightening, pulled forward chip orders into Q3. This is the “overdrawing future demand” that management has warned about repeatedly in earnings calls over the past year.
The implications extend into 2026. If Q3 represented demand acceleration, Q4 would show continued strong sequential growth as that momentum carried forward. Instead, the flat-to-up-2% guide suggests Q3 pulled volume from Q4 and likely Q1 2026. The utilization rate will hold up—SMIC’s customers can’t source elsewhere, so they’ll keep the fabs loaded—but revenue per wafer and product mix will normalize downward.
This matters for margin expectations. Consensus analyst estimates model SMIC reaching 23-25% gross margins by 2027. Those estimates assume both volume growth and mix improvement, with higher-margin automotive and industrial applications (currently 11.9% of revenue) expanding meaningfully. But Q3’s 22% margin came with nearly perfect utilization and favorable mix, and management still guided back to 18-20% for Q4. If SMIC can’t sustain 22% margins under peak conditions, reaching 25% requires either a dramatic capex slowdown (allowing depreciation to peak) or a mix shift so substantial it offsets the depreciation burden. Neither appears imminent.
The Dilution Few Notice
Non-controlling interests claimed $124 million of Q3’s profit, up from $14 million in Q2 and representing 39% of total profit for the period. This isn’t a one-time accounting adjustment. As SMIC’s municipal joint ventures ramp production—Beijing, Tianjin, Shenzhen—the parent company’s share of consolidated profits shrinks even as operational performance improves.
The non-controlling interest equity balance now sits at $11.8 billion against total equity of $33.1 billion. These joint ventures were the mechanism that allowed SMIC to rapidly expand capacity without fully burdening the parent’s balance sheet. But they also create a permanent claim on future earnings. As new fabs reach mature production, NCI profit take will likely increase further before stabilizing.
This structural feature makes SMIC’s P/E ratio more misleading than for typical companies. The current forward P/E of 104x is based on earnings attributable to parent company shareholders. But a meaningful portion of operating improvements flow to non-controlling interests. Investors are paying 104x for what’s effectively a minority economic interest in a high-capex, margin-capped manufacturing operation.
What the Quarter Confirmed
Three months ago, the thesis on SMIC centered on a simple proposition: the company’s capital intensity and operational mandate create a margin ceiling that markets are ignoring. Consensus expected steady margin expansion toward 25% as scale benefits materialized. The thesis argued depreciation math and mission priorities would keep margins in the 18-21% range regardless of volume growth.
Q3 provided the test case. With utilization at 95.8% and favorable product mix, gross margins reached 22%—the highest in recent quarters and above guidance. This was the moment for margins to break out if they ever would. Instead, management immediately guided Q4 back to 18-20%, confirming the ceiling exists even under ideal operating conditions.
The capital expenditure pattern reinforced this. At $2.39 billion for the quarter, capex continues at the pace that creates $4-5 billion in annual depreciation charges. There’s no indication of moderation. The company added 31,500 wafers of monthly capacity in Q3, expanding from 991,250 to 1,022,750 8-inch equivalent wafers. This capacity growth feeds utilization but also extends the depreciation burden forward.
What changed in Q3 isn’t the business model. What changed is the market’s ability to argue the margin ceiling is temporary or cyclical. When you guide margins back down after your best quarter in years, you’re confirming the constraint is structural.
The Repricing Ahead
SMIC currently trades at a forward P/E that would make a software company blush. The market is pricing in both substantial margin expansion and sustained revenue growth. Q3’s results challenge the first assumption directly.
The catalyst for repricing will be the 2026 earnings season. When Q4 results arrive in February, they’ll likely show gross margins in the 18-19% range with revenue roughly flat, despite Q3’s 95.8% utilization. This will force the first round of estimate revisions. Analysts who model 23% gross margins for 2026 will cut to 21%. Those modeling 25% for 2027 will lower to 22-23%.
But the real reckoning comes in the second half of 2026, when the China domestic foundry capacity additions hit the market in force. Over 25 new fabs are scheduled to ramp production across mature nodes—28nm, 40nm, 55nm, and above. These aren’t competing directly with SMIC’s 7nm capability, but they’re targeting the 77% of SMIC’s revenue that comes from 12-inch wafers at mature nodes and the 23% from 8-inch legacy processes.
The policy response matters here. If the Chinese government allows market-based competition among these foundries, utilization rates fall and pricing pressure intensifies. If the government coordinates production allocation and enforces market segmentation, SMIC maintains utilization but likely at compressed ASPs. Either scenario pressures the margin structure that Q3 already showed is capped at 22% under ideal conditions.
When consensus margin estimates for 2027 eventually settle around 19-21% instead of 25%, the valuation multiple must compress. A company with structural gross margins of 20%, perpetual capex equal to 70-80% of revenue, and negative free cash flow doesn’t trade at 70-100x earnings. It trades at 30-40x at most, and that’s generous given the capital intensity.
The Mispricing
At HK$73 and a market capitalization around $40 billion, SMIC is priced as if it will generate returns like a commercial semiconductor company. The Q3 results demonstrate it will not, because it cannot. The mission—ensuring China’s domestic semiconductor supply—requires capacity growth that generates depreciation faster than margin expansion can offset it.
This doesn’t mean SMIC will fail or disappear. The opposite is true. SMIC will endure because its purpose is endurance, not profitability. It will continue adding capacity, maintaining high utilization, and reporting margins in the high teens to low twenties. Revenue will compound as China’s domestic chip consumption grows and localization mandates intensify.
But that revenue growth, which looks impressive in isolation, will be accompanied by proportional depreciation growth. The earnings power will remain constrained. The free cash flow will stay negative. And eventually, the market will price SMIC for what it demonstrably is rather than what consensus hopes it might become.
Q3 was the quarter that made this inevitable. When you beat your guidance, hit record utilization, and immediately guide margins back down, you’re not being conservative. You’re being honest about the constraints you operate under. The question is when the market accepts that honesty and reprices accordingly.
(Related Articles: SMIC: The Great Wall of Silicon)
Disclaimer:
The content does not constitute any kind of investment or financial advice. Kindly reach out to your advisor for any investment-related advice. Please refer to the tab “Legal | Disclaimer” to read the complete disclaimer.


