

Spotify 1Q26 Earnings: The Right Thesis at the Wrong Price
Q1 did not break Spotify’s Taste Graph thesis. It showed what the Taste Graph costs.

TL;DR
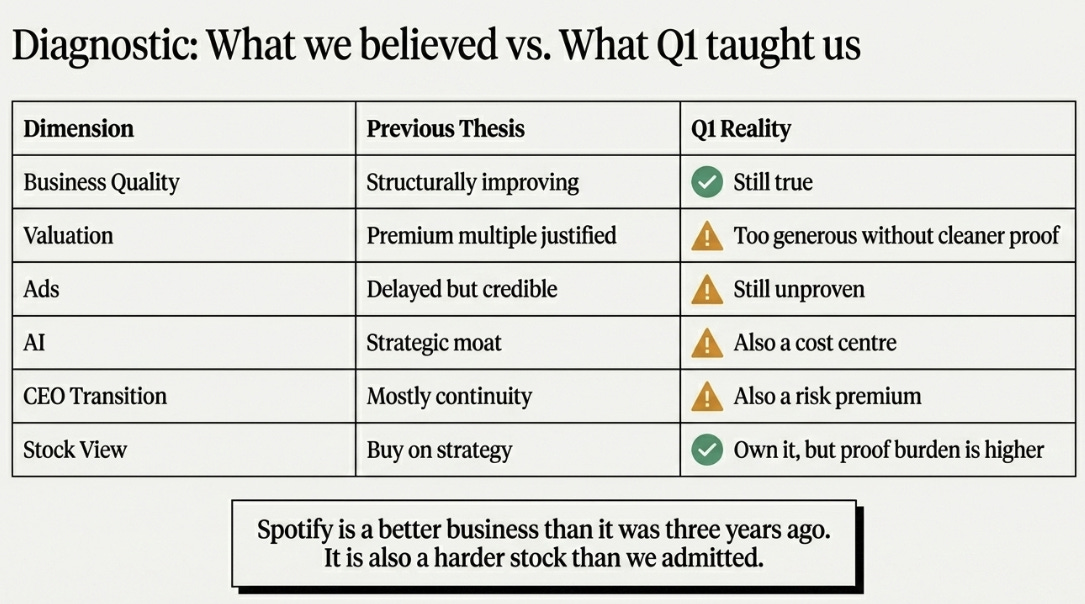
We got the business more right than the stock. Spotify’s evolution from distribution to discovery to Taste Graph still looks intact, but we underweighted valuation, founder-transition risk, and the market’s demand for cleaner operating leverage.
Q1 exposed the proof gap. Premium is working: users held after price hikes, gross margin remained strong, and free cash flow was healthy. But ads remain underproven, operating income quality was flattered by social charges, and AI/product reinvestment is now visible in the P&L.
We still own it at $434. Not because consensus is too low, but because the stock no longer needs a heroic model. If Spotify delivers consensus, there is a path toward roughly $625; if the Taste Graph shows financial proof, the upside case is larger.
Start With the Stock
We need to start with the part that hurts.
I have been positive on Spotify for four consecutive quarters. Over that period, the business improved, but the stock did not. That does not automatically mean the business thesis was wrong, but it does mean the stock thesis was incomplete.
The mistake was not believing Spotify was getting better. It was treating that as sufficient. The market had already priced in a cleaner story: price increases, gross-margin expansion, operating leverage, and free cash flow. Q1 did not break the strategic thesis. It broke the market’s willingness to keep paying for that thesis before the financial proof was obvious.
Spotify is a better business than it was three years ago. It is also a harder stock than we admitted.
The Business Did Not Break
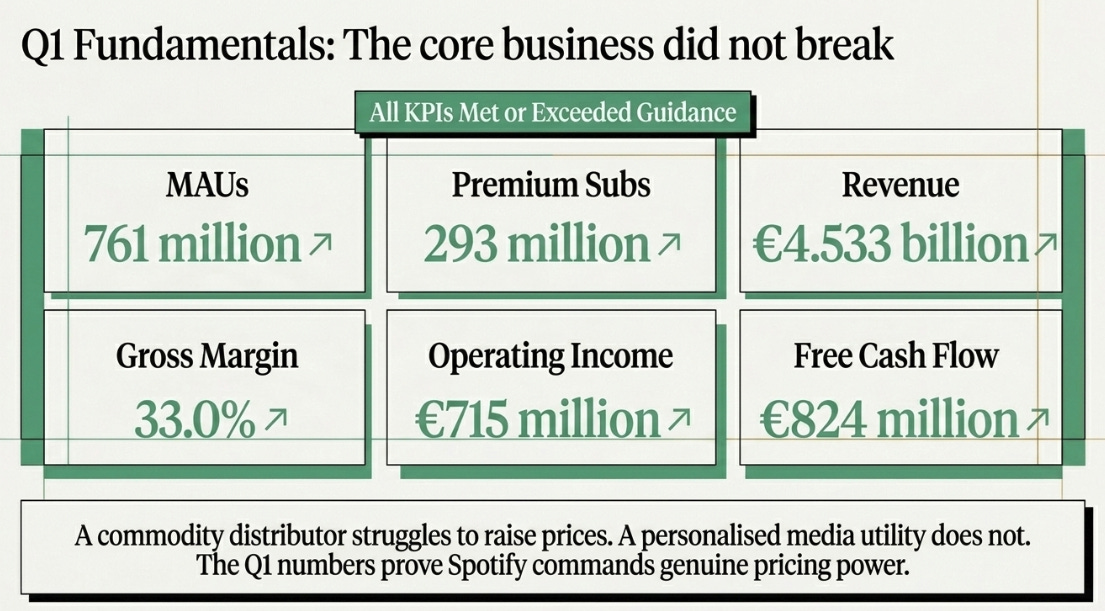
Spotify’s Q1 was not a bad quarter. The company reported 761 million MAUs, 293 million Premium subscribers, €4.533 billion of revenue, 33.0% gross margin, €715 million of operating income, and €824 million of free cash flow. Management said all KPIs met or exceeded guidance: MAUs were above, subscribers in-line, revenue in-line, gross margin above, and operating income above.
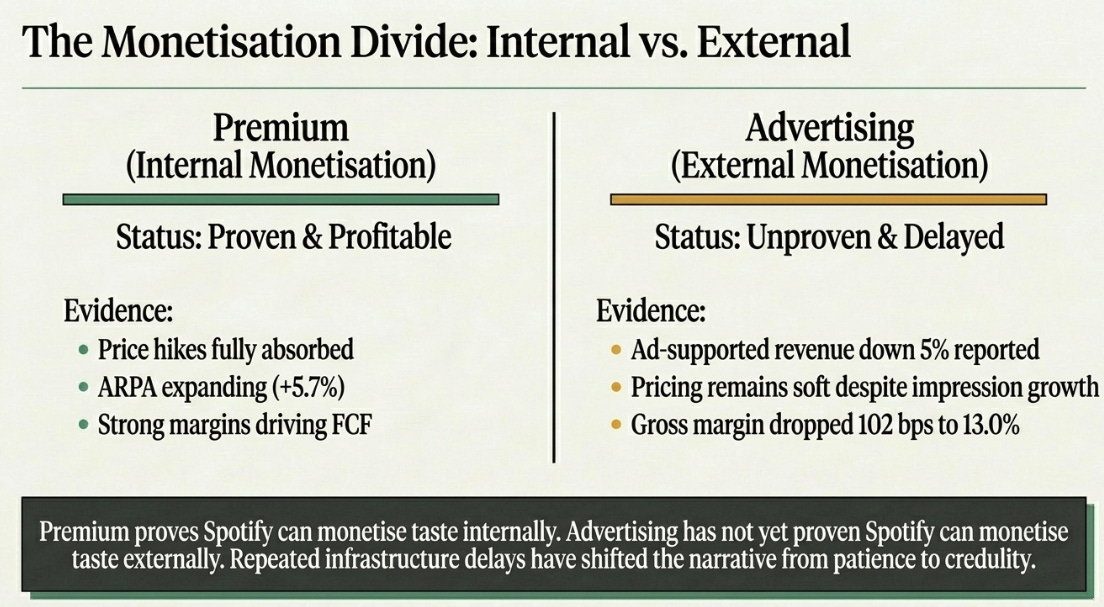
More importantly, the January U.S. price increase did not create obvious churn stress. Management said there were “no surprises” related to price-increase churn, while Premium revenue grew roughly 15% constant currency and ARPA expanded 5.7%.
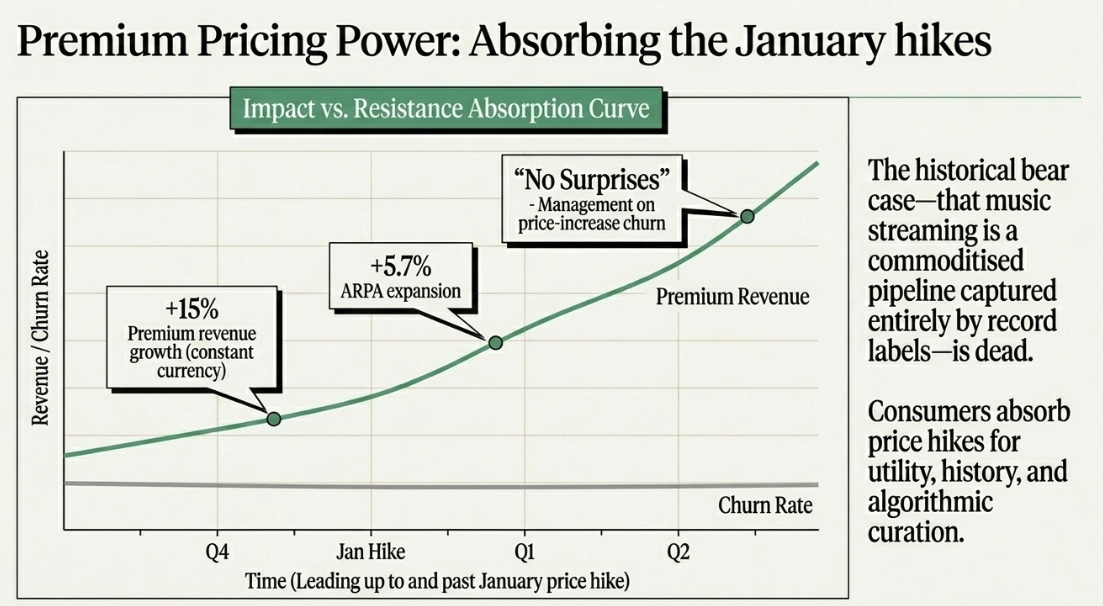
That matters. The old Spotify bear case was simple: music streaming was a commodity business, labels captured the economics, and consumers had limited willingness to pay more. Q1 pushed back against that. A commodity distributor should struggle to raise prices. A personalized media utility with years of listening history, playlists, recommendations, podcasts, audiobooks, video, social loops, and AI interfaces should not.
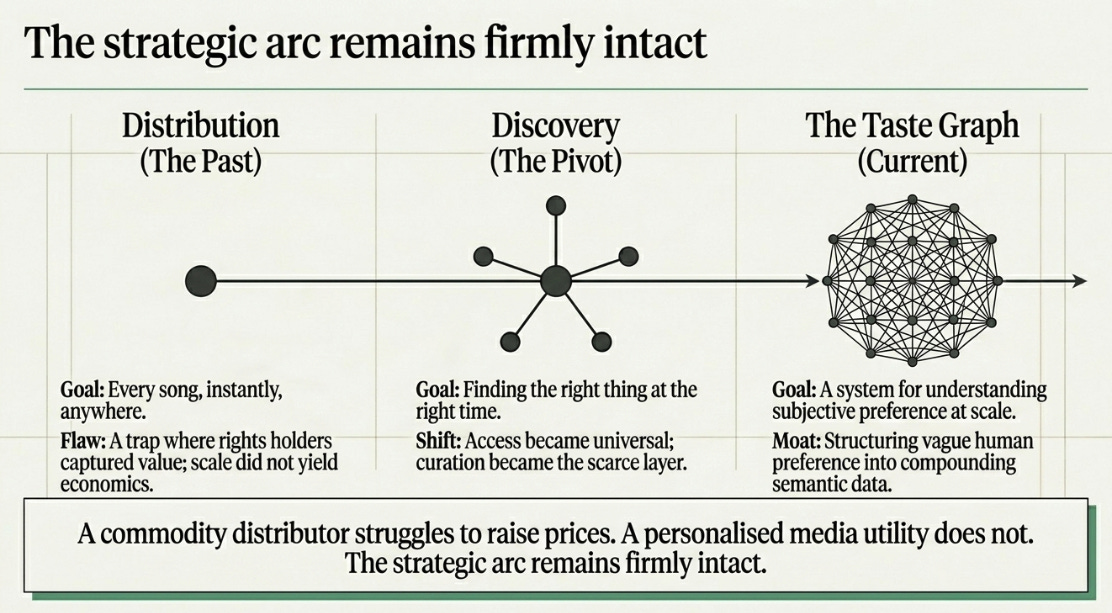
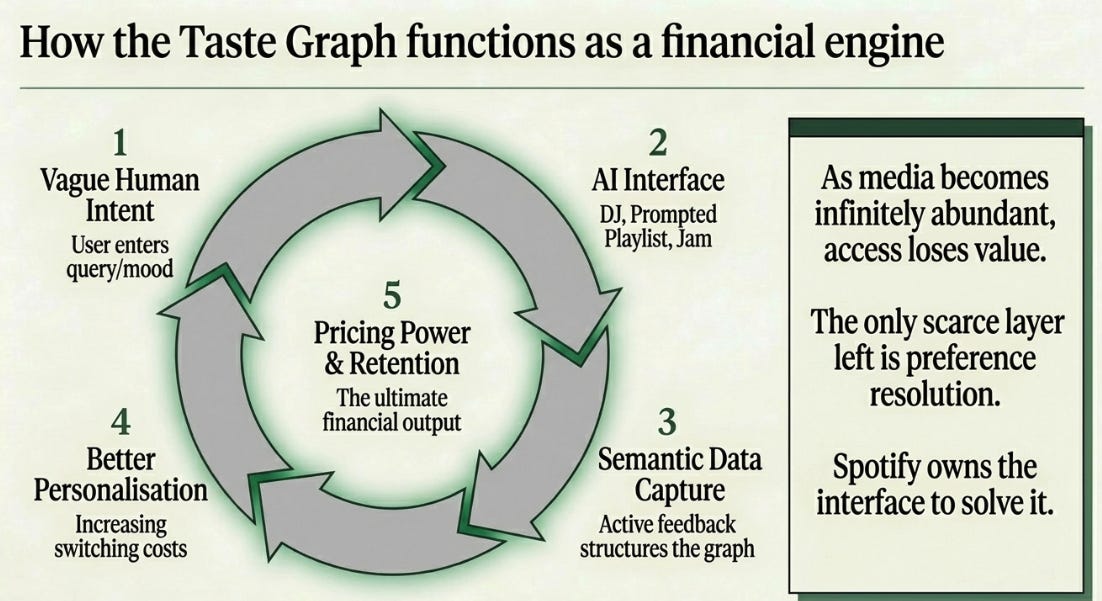
The strategic arc still works. The first Spotify solved distribution: every song, instantly, anywhere. But distribution alone was a trap — rights holders captured much of the value, and scale did not automatically improve the economics. The second Spotify solved discovery: once access became universal, the scarce layer became finding the right thing at the right time. The latest Spotify is the Taste Graph: not merely a music app, but a system for understanding subjective preference at scale.
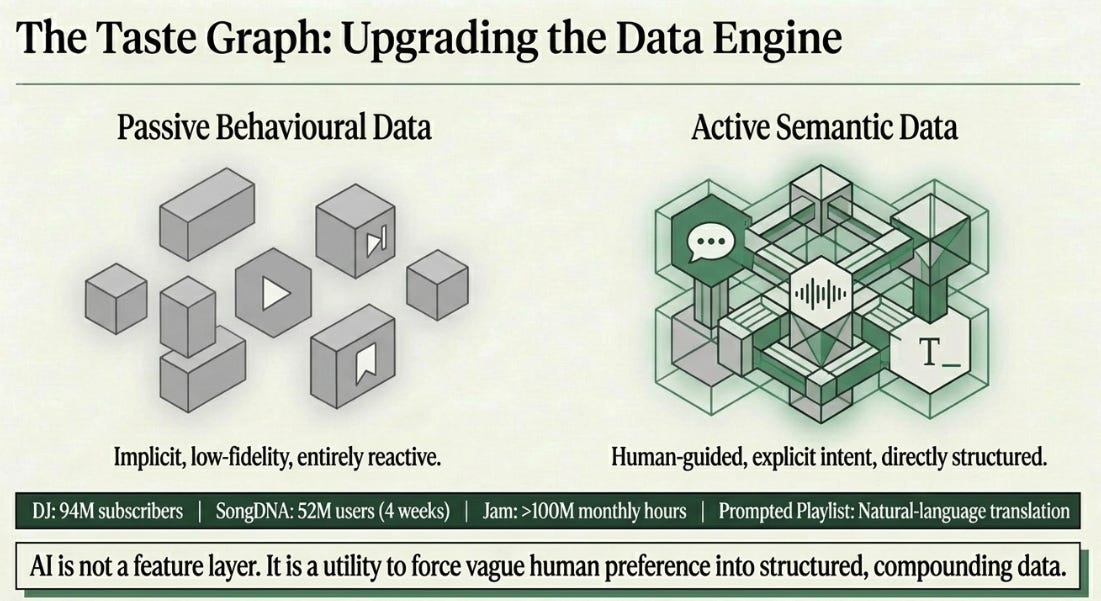
Q1 added evidence. DJ is now used by 94 million subscribers. SongDNA reached 52 million users in four weeks. Jam exceeds 100 million monthly listening hours. Taste Profile lets users refine how Spotify understands their listening, while Prompted Playlist turns natural-language intent into music and podcast discovery.
These are not random features. They increase the amount of preference data Spotify can observe. The old dataset was behavioral: skips, saves, replays, playlists, follows. The new dataset is behavioral plus semantic: users telling Spotify what they want, then confirming or correcting the output through usage.
That is why AI is not simply a feature layer. It is a way to turn vague human preference into structured, compounding data.
What We Underweighted
We underweighted valuation. At a high multiple, “the business is getting better” is not enough. The market needs to know whether the improvement is already priced in, whether the earnings path is smooth enough to sustain the multiple, and whether management will let operating leverage reach the bottom line.
We underweighted the CEO transition. Operational continuity may be real, but investor psychology is real too. A founder moving away from the CEO role changes the risk premium, particularly when the replacement structure is two co-CEOs. That does not mean Alex Norström and Gustav Söderström cannot execute. It means they have to prove they can tell one story, make hard tradeoffs, and keep product ambition and financial discipline synchronized.
Most of all, we underweighted advertising.
For several quarters, advertising has been a “transition” story. At first, that framing was fair. Spotify needed to rebuild its ad infrastructure for a market that had shifted toward biddable, automated buying. But repeated delays change the burden of proof. At some point, “inflection later” stops being patience and starts becoming credulity.
Q1 did not help. Ad-Supported revenue declined 5% reported and rose only 3% constant currency. Management said music advertising benefited from impression growth, but pricing remained soft. Ad-Supported gross margin was 13.0%, down 102 bps, as higher engagement drove music and other costs that more than offset podcast favorability.
The cleanest critique is this:
Premium proves Spotify can monetize taste internally. Advertising has not yet proven Spotify can monetize taste externally.
This does not break Spotify. Premium is too large and too profitable for that. But advertising should be treated as strategic optionality until the numbers prove otherwise.
The Quarter Was Less Linear
The other issue was operating income quality.
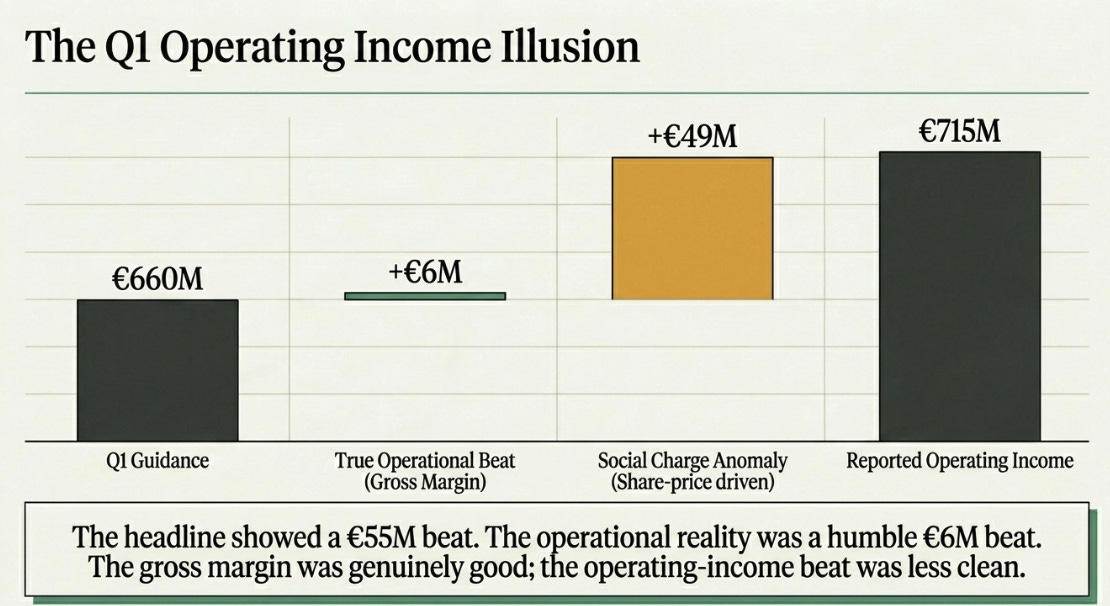
Spotify reported €715 million of operating income versus guidance of €660 million, which looks like a strong beat. But social charges were €49 million below forecast because of share-price movement. Excluding that benefit, the underlying beat was only around €6 million, driven by gross-margin outperformance.
Gross margin was genuinely good. The operating-income beat was less clean.
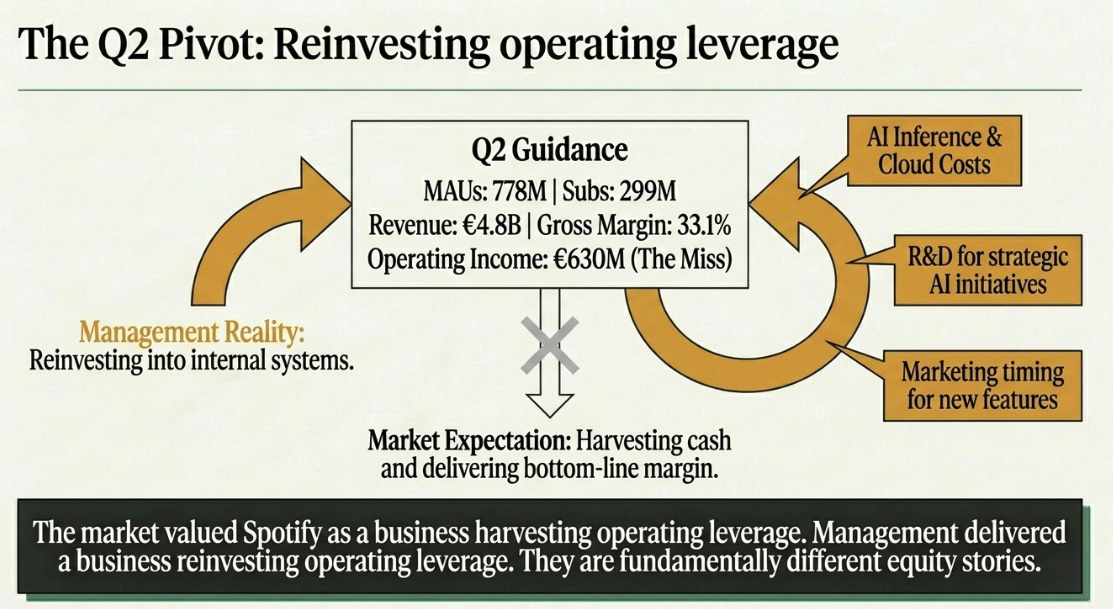
Then came Q2 guidance: 778 million MAUs, 299 million Premium subscribers, €4.8 billion revenue, 33.1% gross margin, and €630 million operating income. The revenue guide was fine. The gross-margin guide was fine. The operating-income guide was the issue.
Management’s explanation was sensible: marketing timing, cloud costs, and R&D tied to strategic AI initiatives. Spotify is not dramatically increasing headcount; it is spending more compute per employee, shipping more, and marketing new features. Management also said OpEx should stay at these levels for the next quarter or two, while still expecting full-year gross margin and operating margin to improve.
That may be exactly the right long-term decision. It is also a stock problem.
The market had started to value Spotify as a business harvesting operating leverage. Management delivered a business reinvesting operating leverage. Those are not the same equity stories.
Spotify did not miss the strategic thesis. It missed the market’s preferred timing of the thesis.
The Big Question
The fundamental question is straightforward:
Does AI make Spotify’s Taste Graph more valuable faster than it raises the cost of building, serving, and monetizing that graph?
The bull case is compelling. More users create more listening history. More history creates better personalization. Better personalization drives more engagement. More engagement improves retention, conversion, and pricing power. More content types create more contexts. More contexts enrich the Taste Graph. AI turns implicit behavior into explicit intent.
Management gave investors this framework directly. Norström said retention is driven by more days in a month, more devices or contexts, and more content types or verticals. Söderström described Spotify as a platform moving from passive recommendation to something users can actively shape and guide.
That is the Taste Graph thesis in management’s own language.
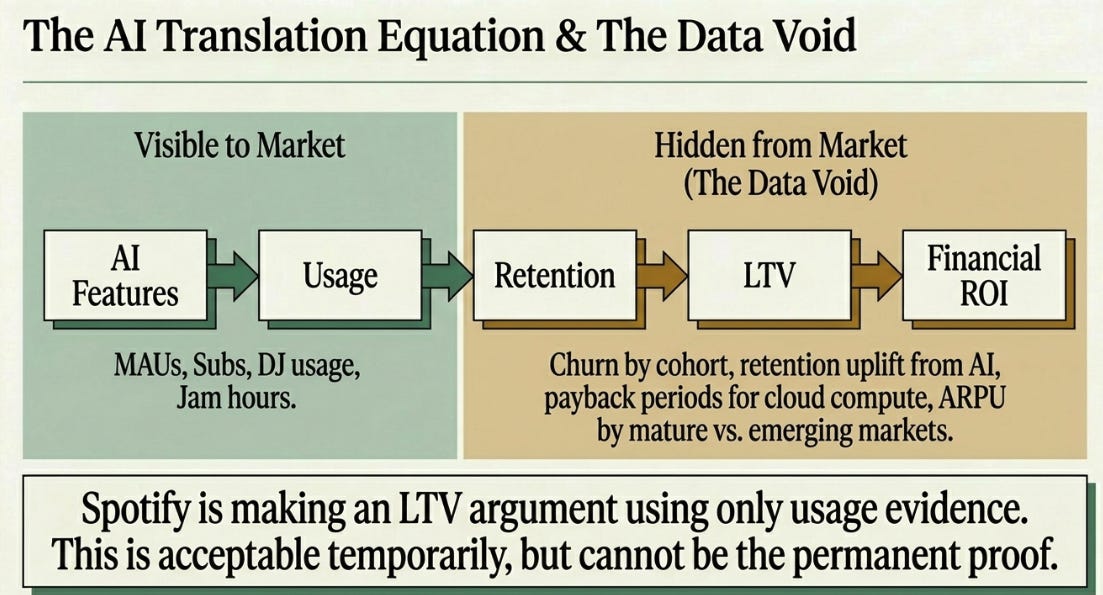
But the negative side is now visible too. AI has costs: inference, cloud, marketing, R&D, and product complexity. Spotify is asking investors to accept this chain of reasoning: usage is a proxy for retention; retention is a proxy for LTV; AI features increase usage; therefore, AI investment should increase LTV.
Directionally, I believe that. But the company has not yet shown the metrics that close the loop.
Spotify shows MAUs, Premium subs, ARPU, DJ usage, SongDNA adoption, Jam hours, and gross margin. Investors need churn by price cohort, ARPU by mature versus emerging markets, retention uplift from AI features, conversion uplift from Prompted Playlist or Taste Profile, ad yield by format, and payback periods for AI/cloud/marketing spend.
That is the fair critique: Spotify is making an LTV argument using usage evidence. That is acceptable for a while. It cannot be the permanent proof.
Why Own It?
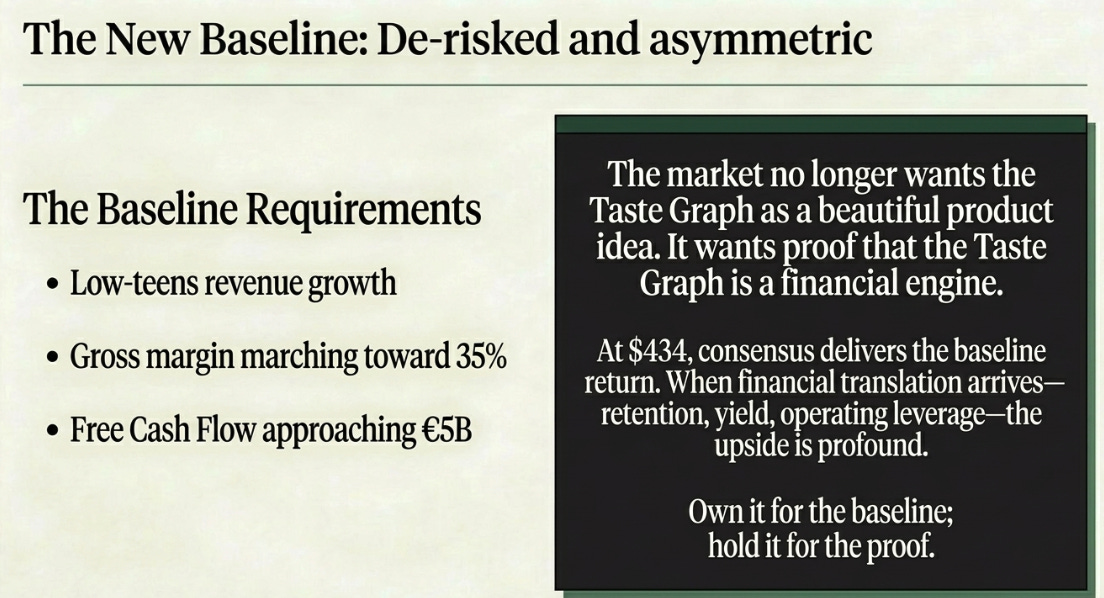
The reason to own it is that at $434, the stock no longer requires a heroic above-consensus model. If Spotify merely lands near consensus — low-teens revenue growth, gross margin moving toward 35%, and free cash flow approaching €5 billion — the stock can work back toward roughly $625. If the Taste Graph starts showing financial proof through retention, ARPU, conversion, or ad yield, the upside case becomes much larger.
That is the difference between now and the highs. At $785, Spotify needed perfection. At $434, consensus can be enough, and the Taste Graph gives us upside optionality.
The core mechanism still works. Spotify’s understanding of taste becomes more valuable as media becomes more abundant. In a world of infinite content, the scarce layer is not access; it is preference resolution. Spotify has the user base, behavioral history, product surface area, and AI interface to make that layer more valuable over time.
The bar has changed. Strategic progress is no longer enough. Spotify now needs to show measurable financial translation: retention, ARPU, conversion, ad yield, or operating leverage.
The cleanest version of the thesis is this: Spotify is a better business than the stock chart suggests, but the stock chart is telling us something real. The market no longer wants the Taste Graph as a beautiful product idea. It wants proof that the Taste Graph is a financial engine.
That is the next Spotify thesis. And it is the one the stock will trade on from here.
Disclaimer:
The content does not constitute any kind of investment or financial advice. Kindly reach out to your advisor for any investment-related advice. Please refer to the tab “Legal | Disclaimer” to read the complete disclaimer.