

Uber Q1 2026: The Missing Half
Q1 2026 didn’t just prove Uber can survive autonomous vehicles. It showed why locked-in demand may be the real moat.

TL;DR
The market’s Uber framework changed: despite a revenue miss and weak GAAP EPS, the stock rose because investors focused on bookings growth, non-GAAP earnings, and stronger-than-expected guidance.
Uber One completes the AV thesis: 50 million members now drive half of gross bookings, suggesting Uber’s demand layer is becoming recurring, bundled, and harder to bypass.
The next leg of repricing depends on proof: Uber needs to show AV take-rate economics, continued Uber One penetration, Delivery margin expansion, and insurance-driven Mobility acceleration.
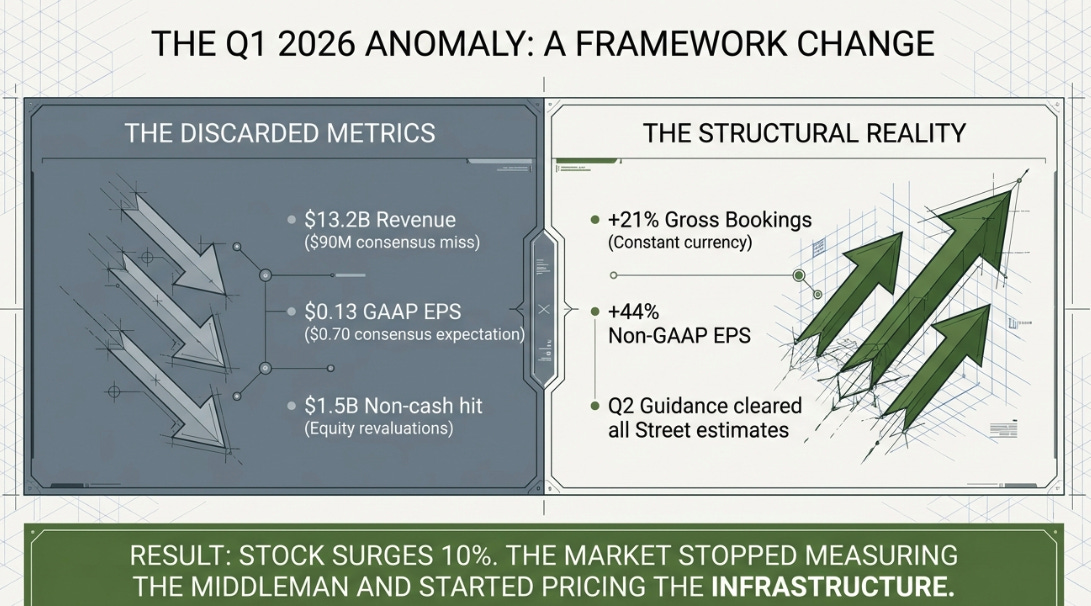
Uber reported first-quarter revenue of $13.2 billion, missing consensus by ninety million dollars. GAAP earnings per share was thirteen cents against expectations of seventy. And the stock went up ten percent.
That reaction is more interesting than anything in the financial statements. A stock does not rise ten percent on a revenue miss and an earnings collapse unless investors have decided they were measuring the wrong thing. What happened on May 6th was not a response to a good quarter. It was a framework change. The market looked past revenue, looked past GAAP earnings, looked past the $1.5 billion non-cash hit from equity revaluations in Didi and Grab, and decided that the things that actually matter, gross bookings growth of twenty-one percent constant currency for the third consecutive quarter, non-GAAP earnings per share up forty-four percent, and a Q2 guide that cleared every estimate on the Street, were the numbers worth paying for.
I want to sit with that for a moment, because it changes the posture of everything I have been writing about this company.
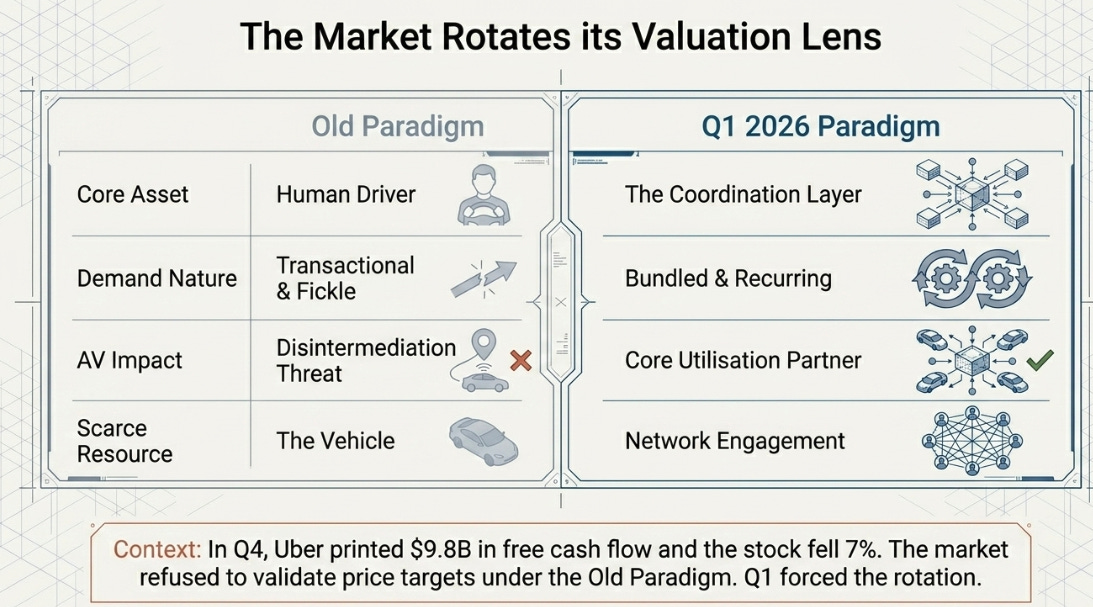
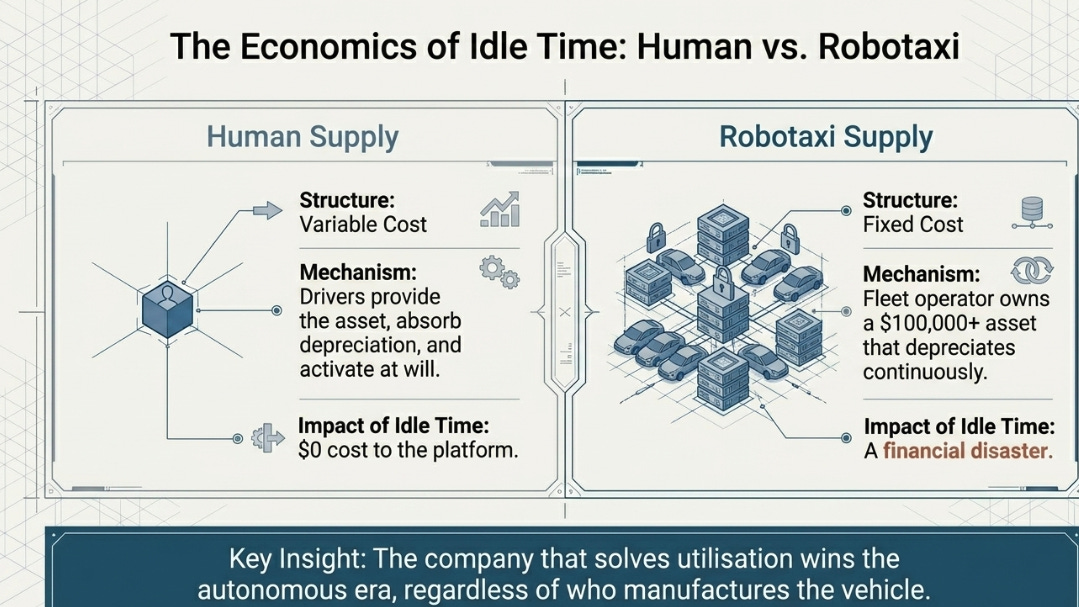
For eighteen months I have argued that the market was looking at Uber through the wrong lens. The prevailing fear was autonomous vehicles: if cars drive themselves, who needs a platform connecting riders to drivers? Uber becomes the middleman that technology eliminates. My view was the opposite. I argued that the scarce resource in an autonomous world would not be the car itself but utilization, keeping expensive fixed-cost assets productively busy. Human-driven Uber supply is variable cost: drivers bring their own car, absorb the depreciation, and turn on the app when they feel like earning. Robotaxis are fixed cost: someone owns a hundred-thousand-dollar asset that depreciates whether it is moving or not. At those price points, idle time is not a missed opportunity. It is a financial disaster. The company that solves utilization wins the autonomous era, regardless of who manufactures the vehicle.
That was the through-line of every prior article, Ford’s system versus Ford’s car, Microsoft’s Windows versus the PC manufacturers, Insull’s demand programming versus his generators, the lighthouse that enables the fleet rather than profiting from individual ships. Uber’s real asset was not the driver or the vehicle. It was the coordination layer that made capacity useful.
Every quarter I made this case, the market disagreed. The stock traded between sixty-eight and eighty dollars. Analysts maintained hundred-dollar-plus price targets that the market refused to validate. Q4 was the sharpest disconnect: Uber printed $9.8 billion in annual free cash flow and the stock fell seven percent.
Then came Q1. And for the first time, the market agreed.
That creates a new problem for someone who has been writing against consensus for five articles. If the market is beginning to see what you see, the question is no longer “what is the market missing?” It is “how far does the repricing go, and what determines the distance?”
The answer, I think, is that the repricing has only started. Because Q1 did not just confirm the old thesis. It completed it.
The Thesis Had a Hole
The utilization argument was always a supply-side thesis. It explained why autonomous vehicle companies might need Uber: because expensive fleets need demand aggregation to achieve acceptable returns on capital. Waymo can deploy a thousand cars in San Francisco, but if those cars sit idle forty percent of the day because consumers have not built the habit of opening the Waymo app, the return on invested capital is catastrophic. Uber, with two hundred million monthly consumers, solves that problem on day one.
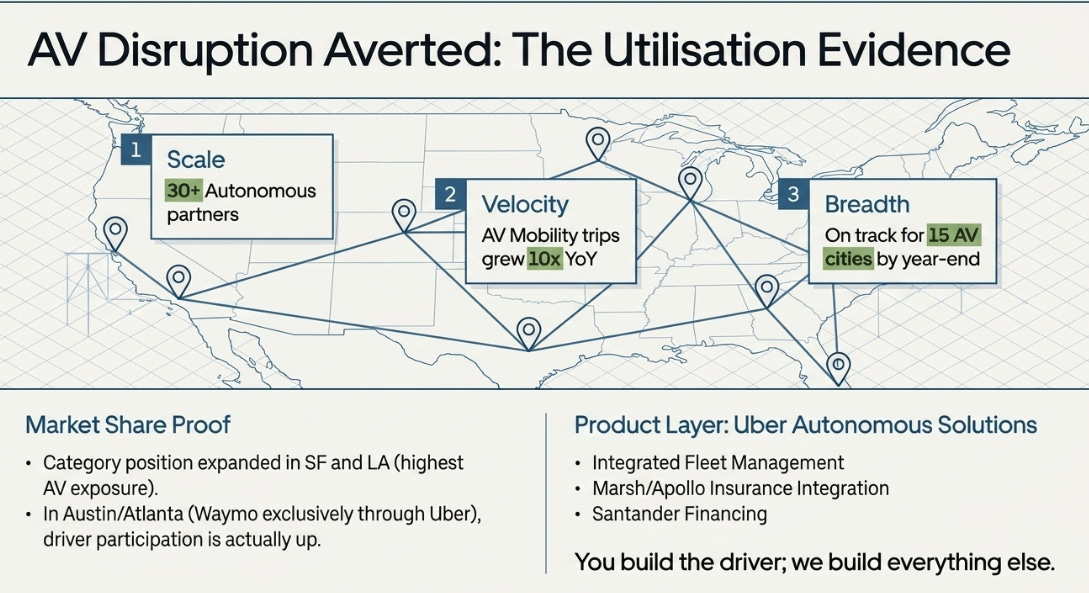
This logic holds up. Uber said this quarter that it now has more than thirty autonomous partners, that AV Mobility trips grew more than ten times year over year, and that the company remains on track to facilitate AV rides in up to fifteen cities by year-end. It launched Uber Autonomous Solutions, fleet management, insurance through Marsh and Apollo, financing through Santander, charging infrastructure, which is Uber explicitly productizing the coordination layer for AV operators. The message to every robotaxi company is the same: you build the driver; we will build everything else.
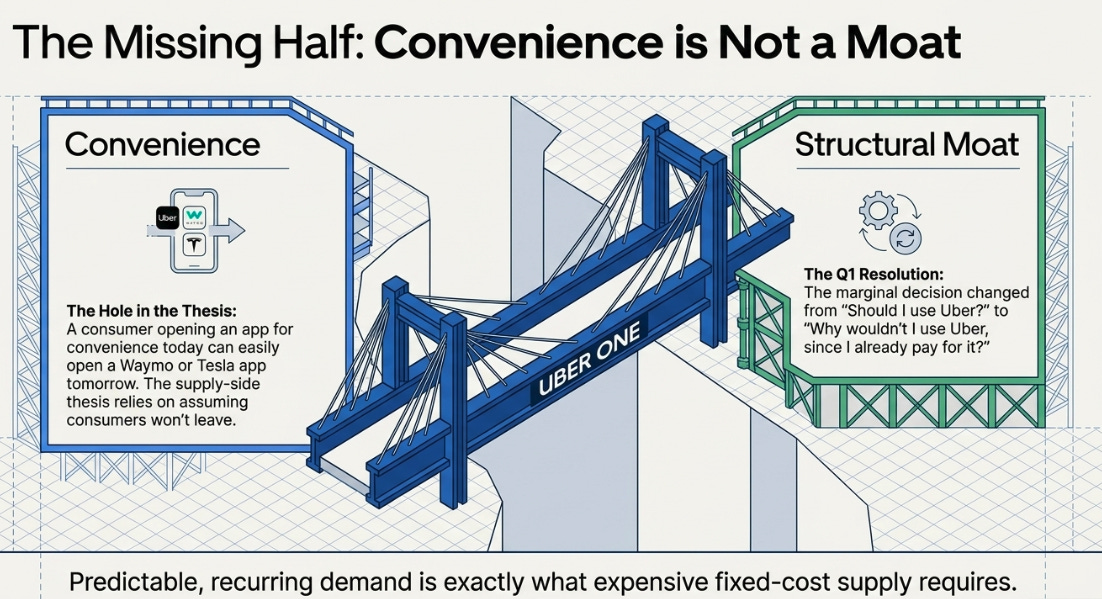
But the supply-side argument always left a demand-side question unresolved. If Uber’s value depends on owning the consumer relationship, how strong is that relationship really? Is it habitual and locked in, or is it transactional and easily redirected? A consumer who opens the Uber app because it happens to be the most convenient option today could just as easily open a Waymo app or a Tesla app tomorrow if the price or experience is better. Convenience is not a moat. It is a temporary advantage that erodes the moment someone offers a more convenient alternative.
That was the hole in the thesis. And Q1 filled it.
Fifty Million Reasons
The most important number in the quarter was not revenue, not earnings, not bookings. It was this, from Dara Khosrowshahi’s opening remarks: Uber One has reached fifty million members, and those members now drive half of all gross bookings across Mobility and Delivery.
Half. From roughly one-quarter of the monthly active user base.
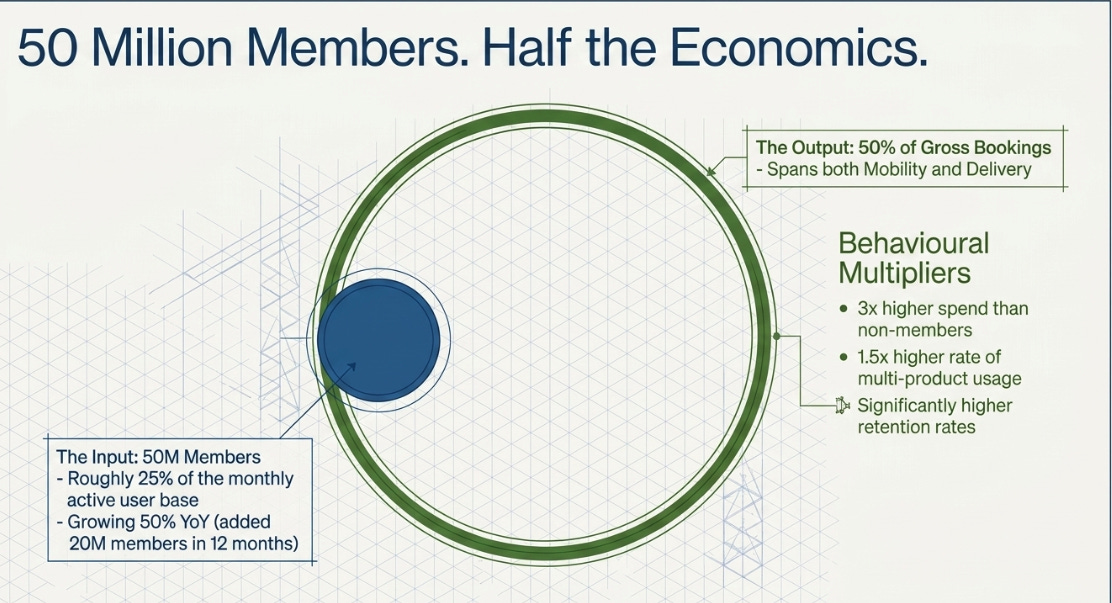
This changes how the demand layer should be understood. A marketplace with two hundred million monthly consumers has demand. A marketplace where fifty million subscribed members generate half of the economic activity has something qualitatively different: a recurring relationship with its most valuable customers. These members spend three times more than non-members. They retain at higher rates. They use multiple products at one and a half times the rate of single-product consumers. And the program is growing at fifty percent year over year, which means Uber added twenty million members in twelve months.
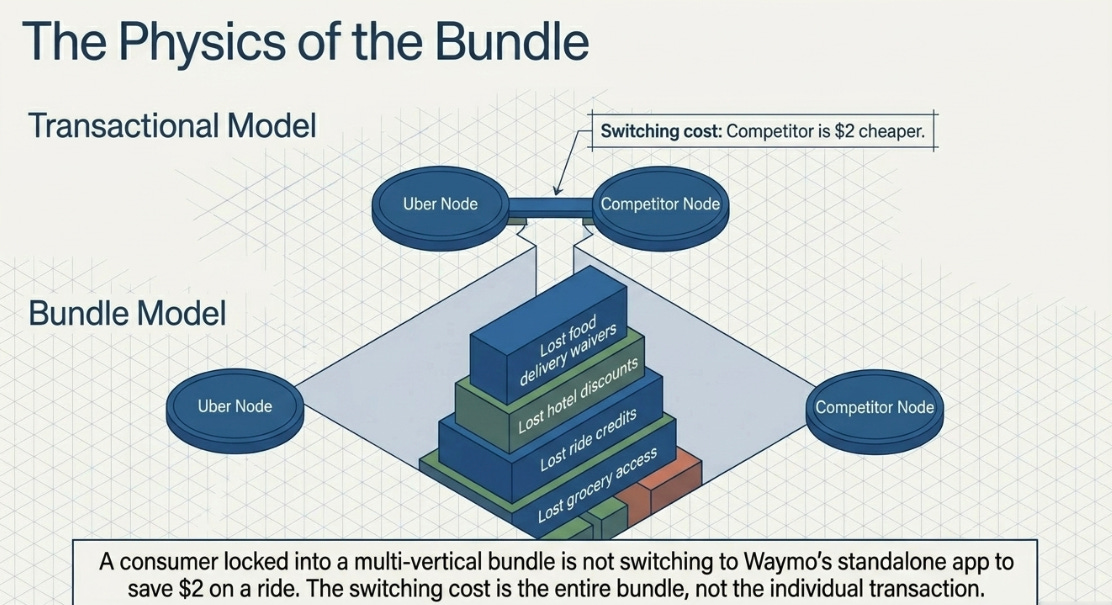
The behavioral mechanism is what matters. Once a consumer pays ten dollars a month for ride credits, delivery fee waivers, and hotel discounts, the marginal decision changes. The question is no longer “should I use Uber for this?” It becomes “why wouldn’t I use Uber, since I already pay for it?” Every new vertical Uber adds, hotels, grocery, parking, travel, becomes another reason to justify the membership, which increases engagement across all verticals. The bundle is the moat, not any individual product.
This is why the hotel launch through Expedia is more interesting than it looks. Khosrowshahi explained on the call that Uber Reserve, the pre-booking product originally built for airport trips, proved the company could move consumers from on-demand behavior to planned behavior. He then connected this to the travel opportunity: airports represent roughly fifteen percent of Mobility bookings, forty percent of U.S. riders take trips outside their home city, and Uber saw 1.5 billion trips outside users’ home cities last year. Hotels are not a random adjacency. They are an attempt to capture movement intent earlier in the journey and wrap it in Uber One economics.
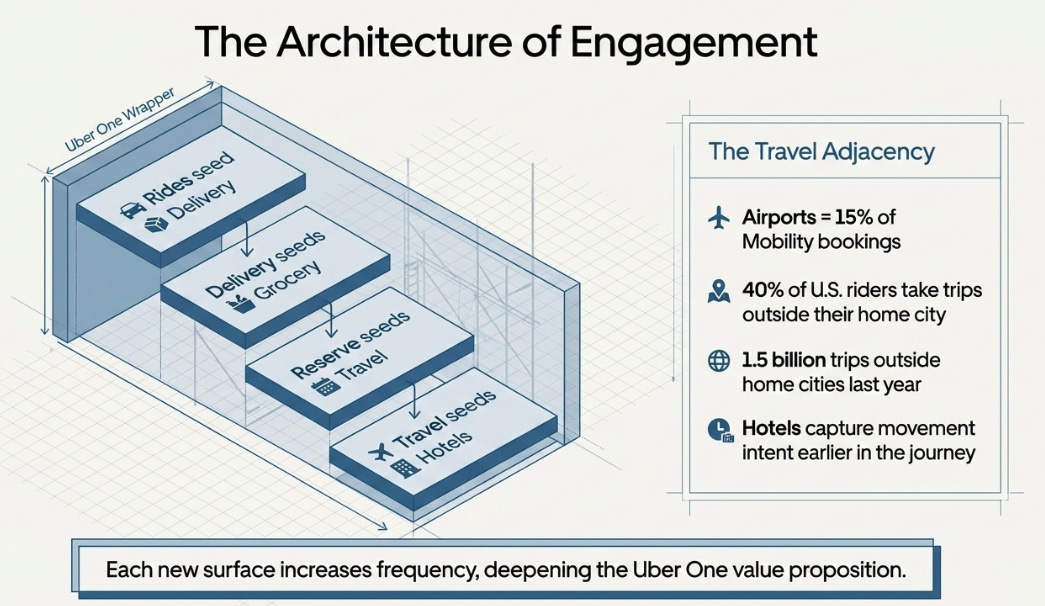
The pattern is the same across every expansion: use one behavior to seed the next. Rides seed delivery. Delivery seeds grocery. Reserve seeds travel. Travel seeds hotels. Uber One ties them together. Each new surface increases frequency, which deepens the membership value proposition, which makes the next expansion easier to justify.
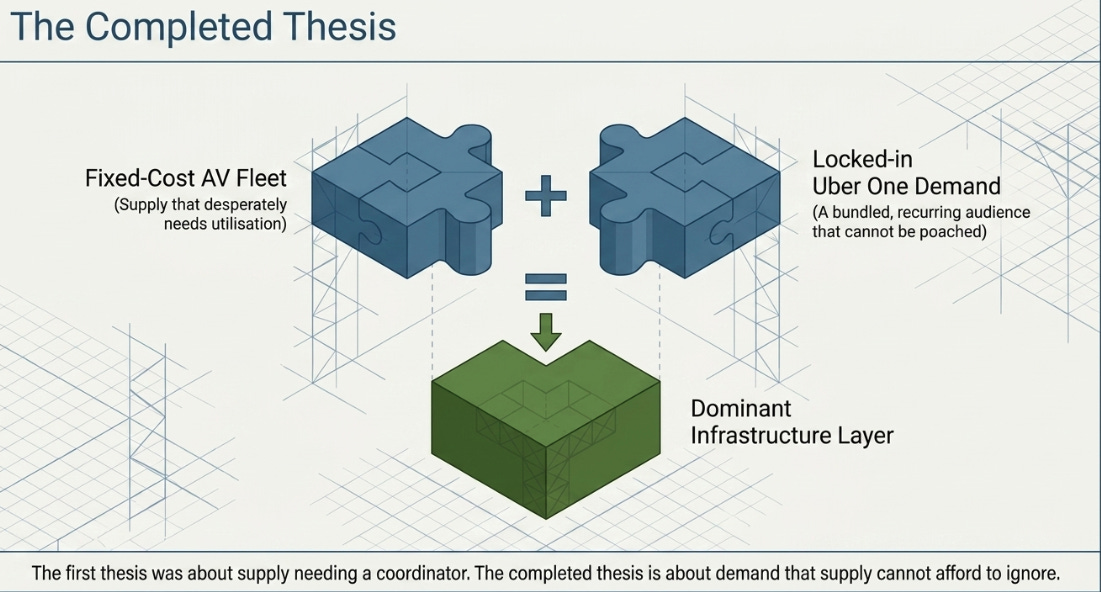
This is the missing half of the utilization thesis. The first version explained why supply might need Uber. The second version, the one Q1 revealed, explains why demand is becoming harder to redirect away from Uber. A consumer locked into a membership bundle that spans rides, food, grocery, and hotels is not switching to Waymo’s standalone app to save two dollars on a ride. The switching cost is the bundle, not the individual transaction.
And that matters for everything. It matters for delivery margins. It matters for advertising. It matters for hotel conversion. It matters for the economics of autonomous vehicles. Predictable, recurring demand is exactly what expensive supply needs, whether that supply is a human driver, a courier, a restaurant, or a robotaxi.
The first version of the Uber thesis was about keeping supply busy. The completed version is about keeping supply busy with demand that is locked in.
The Question That Narrowed
The AV bear case has not disappeared. But it has become more specific, which is progress.
The old question was existential: will autonomous vehicles destroy Uber? The new question is economic: what take rate and margin does Uber earn when AV supply plugs into its network?
Q1 moved the evidence in Uber’s favor. Management said category position in San Francisco and Los Angeles, the two U.S. cities with the most autonomous vehicle exposure, expanded over the past six months. In Austin and Atlanta, where Waymo operates exclusively through Uber, driver earnings are up and more drivers are joining. Khosrowshahi said explicitly: “At this point, we don’t see any effect of the Waymo launches on our overall business.”
If AVs were disintermediating Uber, these metrics would be moving the other direction. They are not. The evidence is consistent with the category expansion thesis, autonomous vehicles grow the total ride-hailing market rather than cannibalizing Uber’s share of it.
But I want to be honest about what remains unproven.
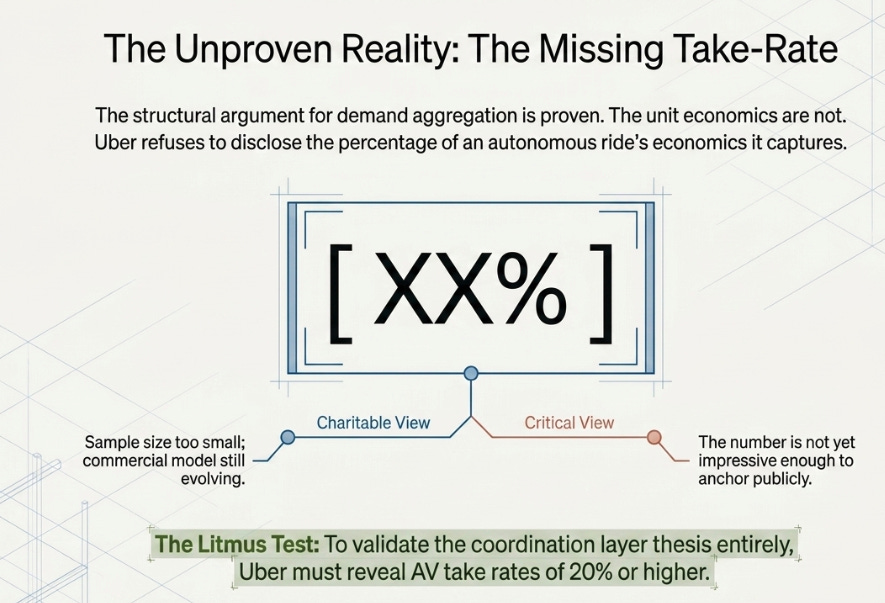
Uber still has not disclosed the single number I called the most important metric in my February article: the take rate on autonomous rides. Management gave us “ten times year-over-year growth” in AV trips, a relative metric without a base. They launched an entire autonomous services suite. They signed financing and insurance partnerships. But they did not tell us what percentage of an autonomous ride’s economics Uber captures.
The charitable interpretation is that the sample size is too small and the commercial model is still being established. Management does not want to anchor a number that will evolve as AV deployment scales. The less charitable interpretation is that the number is not yet impressive enough to share. I do not know which is true. But I do know that a thesis about Uber becoming the coordination layer for autonomous mobility requires, at some point, evidence that the coordination layer earns an attractive toll. Structural arguments about utilization and demand aggregation are necessary. Disclosed unit economics are what makes them investable.
If Uber reports Q2 without disclosing AV take rates, I will interpret that as a signal the economics are not yet where management wants them. If take rates are disclosed at twenty percent or higher, the thesis strengthens materially. This is the single most important number Uber is not sharing.
The Hidden Flywheel
The most underappreciated part of the quarter was not about AVs or membership. It was about insurance.
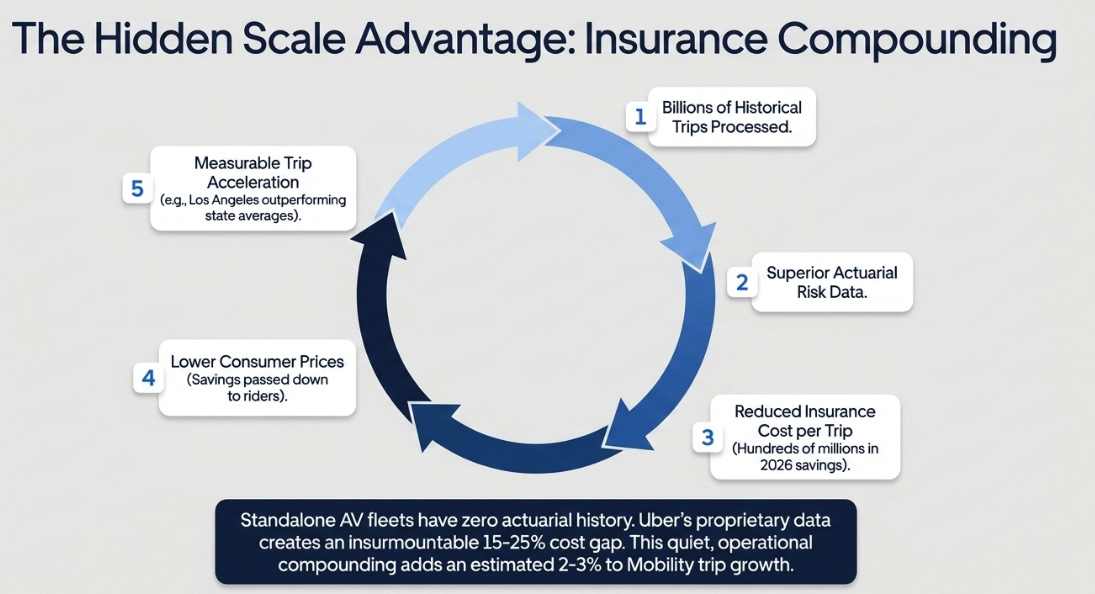
Uber’s CFO said the company expects hundreds of millions of dollars in insurance savings in 2026, driven by policy work, technology improvements, favorable renewals, and increased risk transfer to third-party carriers. Then he said the more interesting part: Uber is passing some of those savings back to consumers through lower ride prices, and the lower prices are driving measurable trip acceleration, particularly in Los Angeles and across California.
This is a compounding mechanism hiding in the cost structure. More trips generate more actuarial data. Better data reduces insurance cost per trip. Lower insurance costs enable lower consumer prices. Lower prices drive more trips. The cycle repeats.
The reason this matters for the broader thesis is that it is a scale advantage no competitor can replicate without Uber’s data. Uber’s captive insurance subsidiary processes claims from billions of historical trips across thousands of cities. A standalone AV fleet with a thousand vehicles has essentially no actuarial history. The insurance cost gap between Uber and a new entrant could be fifteen to twenty-five percent, and that gap widens with every additional trip Uber processes.
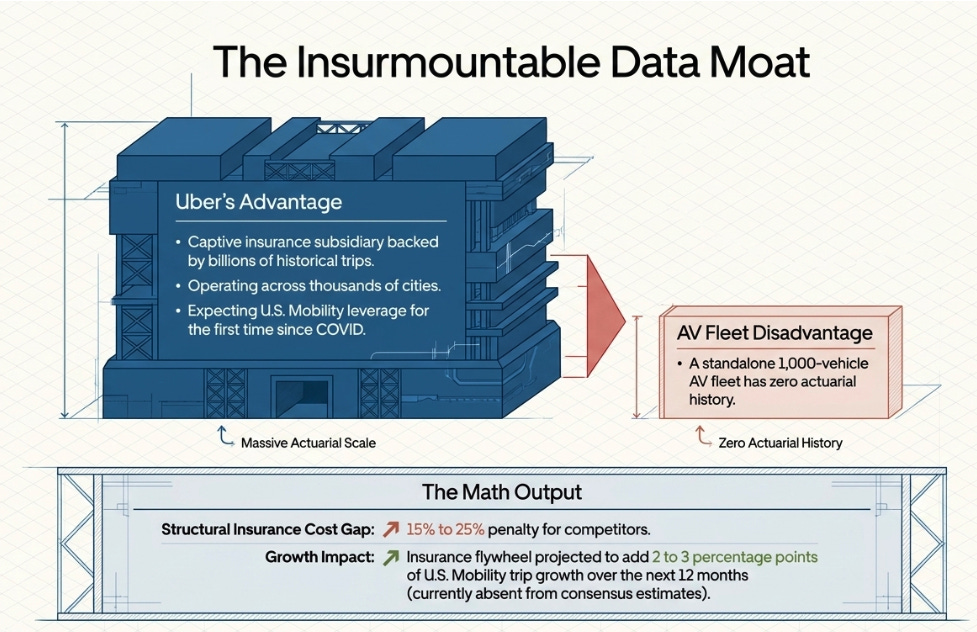
In my Q3 article I used Samuel Insull’s electrification of Chicago as an analogy for how Uber programs demand to fill idle hours. The insurance flywheel is a different expression of the same underlying dynamic. Insull drove down unit costs by improving utilization. Uber is driving down unit costs through data-driven risk reduction. Both are mechanisms where scale advantage compounds rather than dissipates.
The CFO said this would be the first year since COVID where Uber expects good leverage on the insurance cost line for U.S. Mobility. If Los Angeles is the leading indicator, where trip growth is running significantly above the California and national averages, then the insurance flywheel could add two to three percentage points of Mobility trip growth over the next twelve months. That is not in consensus estimates. And it is the kind of quiet, operational compounding that drives durable outperformance rather than quarterly beats.
The Honest Reckoning
Being early on a thesis is not the same as being right about all of it. Five articles in, with the market beginning to agree, this is the right moment to confront the tension I find most uncomfortable.
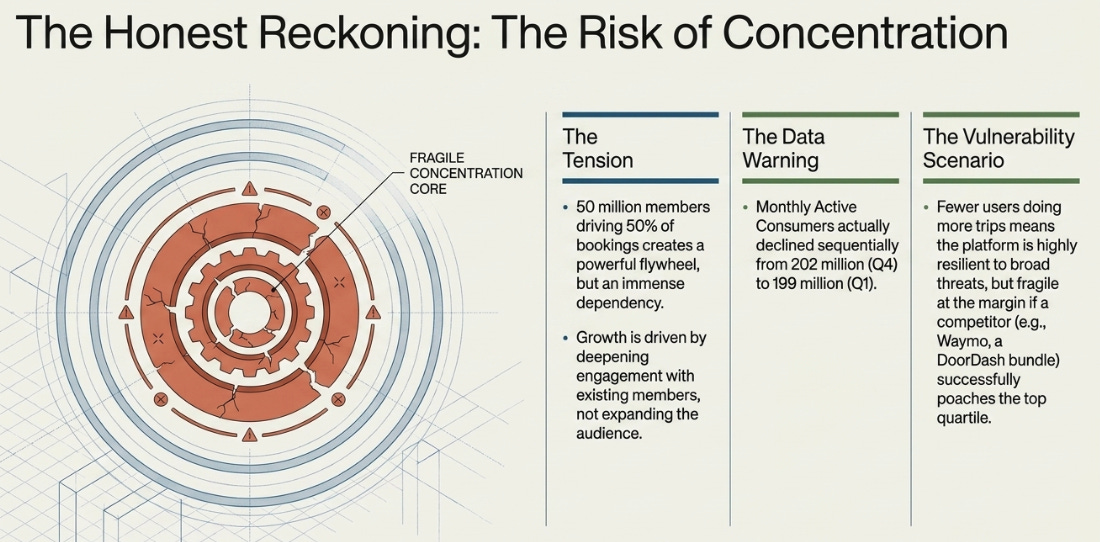
Uber One’s success creates a concentration question that the bull case tends to gloss over. Fifty million members driving fifty percent of bookings is a powerful flywheel. It is also a dependency. One-quarter of the user base generating half the economics means Uber’s growth is increasingly driven by deepening engagement with existing high-value members rather than expanding the audience.
Monthly active consumers actually declined sequentially from 202 million in Q4 to 199 million in Q1. Management did not mention this on the call. They highlighted year-over-year growth, the Uber One milestone, and trip growth instead. The sequential decline is almost certainly seasonal, Q4 holiday demand brings in occasional users who do not return in January. But the pattern it suggests deserves attention: fewer users doing more trips, spending more per trip, locked in through membership. The platform becomes more resilient to competitive threats but more vulnerable to anything that disrupts the high-frequency member cohort specifically.
No such disruptor exists today. But the shape of the risk is worth naming. If a competitor, Waymo with a superior autonomous experience, or a hypothetical DoorDash membership bundle that undercuts Uber One on price, figured out how to poach the top quartile of Uber’s member base, the impact on bookings would be disproportionate to the number of users lost. The membership concentration that makes Uber’s demand layer so powerful is the same concentration that makes it fragile at the margin.
I do not think this is an imminent risk. But I think it is the right risk to monitor, because the bulls, including me, have spent more time celebrating Uber One’s growth than stress-testing what happens when growth slows.
Where the Remaining Distance Lives
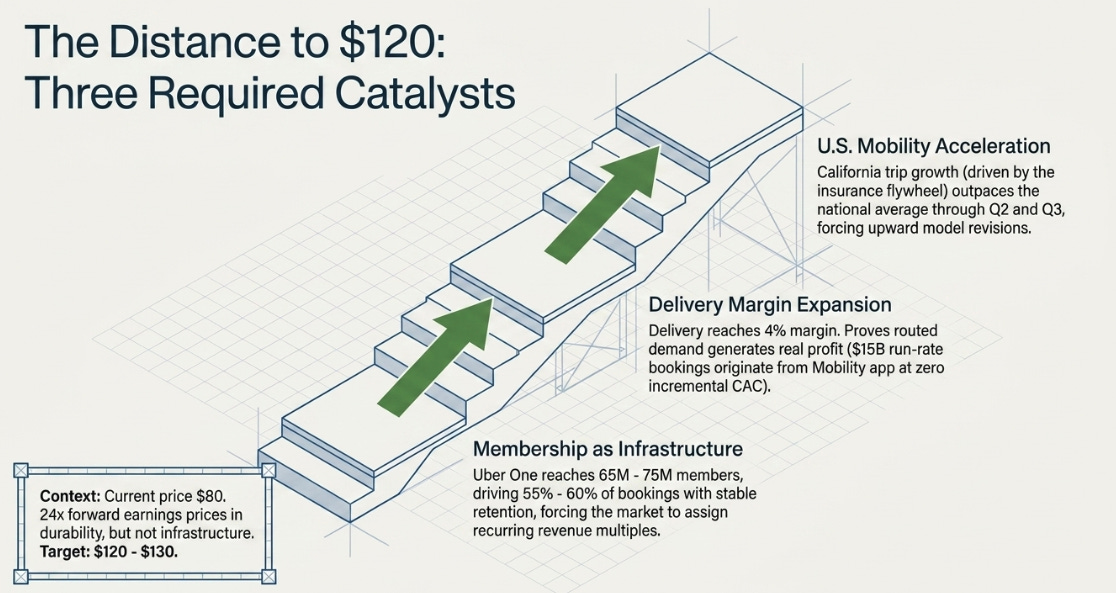
The market moved from pricing Uber as a disruption victim at sixty-eight to seventy-three dollars to pricing it as a platform with a plausible thesis at eighty. That is meaningful. It is also not finished.
At eighty dollars and twenty-four times forward earnings, the stock reflects acceptance that Uber is not being displaced in the near term, that bookings growth is durable, and that earnings are compounding at twice the rate of revenue. What it does not yet reflect is Uber being valued as infrastructure, the demand layer that fragmented supply must flow through, with a membership base that makes that demand recurring rather than transactional.
The distance between eighty dollars and what I believe the business is worth, somewhere around a hundred and twenty to a hundred and thirty in the base case, depends on three things over the next twelve months. None of them are about AV trip counts.
The first is Uber One proving it is infrastructure rather than a loyalty program. If membership reaches sixty-five to seventy-five million and drives fifty-five to sixty percent of bookings with retention rates holding, the market will have to start valuing the membership base the way it values recurring revenue in other businesses. A platform where the majority of economic activity comes from pre-committed members is a different animal than a marketplace where consumers choose transactionally each time. It commands a different multiple.
The second is Delivery margins reaching four percent of bookings and proving that demand routing generates real profit. Delivery is the working proof that the coordination thesis produces financial results, not just strategic narratives. Fifteen billion dollars of Delivery run-rate bookings already originate from the Mobility app at zero incremental customer acquisition cost. If the margin on that routed demand continues expanding, it validates the same mechanism that will eventually make AV coordination profitable.
The third is the insurance flywheel showing up in sustained U.S. Mobility acceleration. If California trip growth continues outpacing the national average through Q2 and Q3, this moves from hidden advantage to consensus growth driver, and from there into models that currently do not include it.
The AV thesis remains the long-term option value. But the near-term repricing depends on the platform thesis. And the platform thesis, as of Q1 2026, is no longer speculative. It is accumulating evidence.
The View From Here
For five articles I argued that the market was focused on the wrong thing. That autonomous vehicles were not the threat the stock price implied. That Uber’s coordination layer, its ability to keep supply busy, to route demand efficiently, to program idle hours into productive ones, was being ignored while the market fixated on a future where robots replace drivers.
Q1 was the quarter where the market started listening. Not because the numbers were perfect, revenue missed, GAAP earnings were ugly, free cash flow barely grew. Because the numbers that actually measure the business pointed in a single direction: the platform is compounding, demand is locking in, and the coordination layer is getting stronger.
The thesis I started with was about busy cars. Utilization as the scarce resource. Uber as the system that keeps expensive assets productive.
That thesis was incomplete.
What Q1 revealed is the other half: the demand that makes utilization valuable is becoming bundled, habitual, and harder to bypass. Fifty million members driving half of bookings. Cross-platform consumers growing faster than single-product users. Insurance savings cycling back into demand acceleration. Delivery margins expanding because routed demand converts at higher margins than acquired demand.
The first version of the Uber thesis was about supply needing a coordinator. The completed version is about demand becoming the thing that supply cannot afford to ignore.
That is a more powerful thesis. It is also a more testable one. The evidence is arriving quarter by quarter. The market has started to reprice it. And at eighty dollars, I believe there is considerable distance left to travel.
Disclaimer:
The content does not constitute any kind of investment or financial advice. Kindly reach out to your advisor for any investment-related advice. Please refer to the tab “Legal | Disclaimer” to read the complete disclaimer.