Uber's 3Q25 Earnings: The Hours That Matter
Q3 looked like margin hesitation. Read correctly, it was an operating choice: trade a few basis points today to make humans and machines busier tomorrow.
TL;DR
Q3 wasn’t weakness—it was orchestration. Uber is trading short-term margin for long-term capacity utilization across humans, AVs, and couriers.
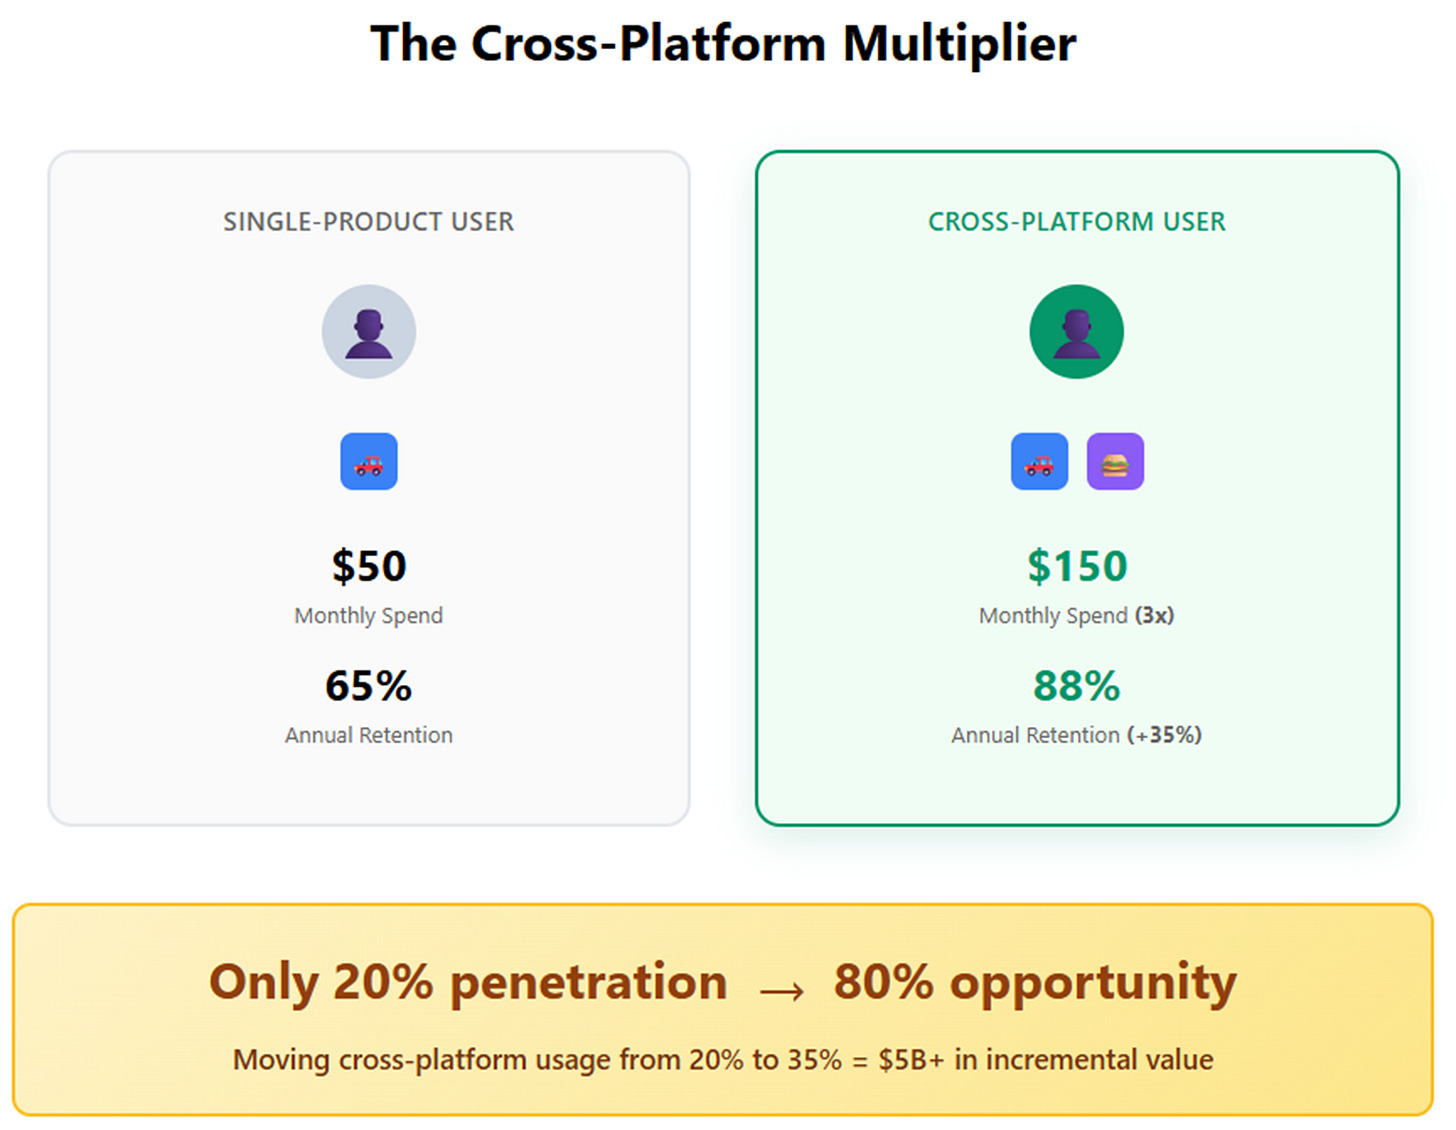
Cross-platform usage is the growth engine. Only 20% of users engage with both Mobility and Delivery, but they generate 3x spend and 35% better retention.
The real battle is for busy hours. From autonomous vehicle deployments to grocery and Uber One, Uber is building a system where utilization—not asset ownership—is the moat.
In May 2025, Uber made an organizational change that seemed routine: Andrew McDonald became Chief Operating Officer with both Mobility and Delivery reporting to him. For over a decade, these businesses had operated as separate P&Ls, each optimizing for its own metrics. The Mobility team maximized ride revenue; the Delivery team maximized order revenue. Neither optimized for what happens when the same person uses both services throughout their day.
Six months later, Q3 results revealed why the consolidation mattered. Trips grew 22% YoY to 3.5 billion—the fastest growth since 2023. Gross bookings rose 21% to $49.7 billion. Monthly active consumers reached 189 million, up 17%. Adjusted EBITDA grew 33% to $2.3 billion, generating $2.2 billion in free cash flow.
Then CFO Prashanth Mahendra-Rajah said Uber was “very deliberately moderating the pace of margin expansion” to invest in growth opportunities. The stock sold off 5%. What the market saw as weakness—margin compression from competition—was actually strategic investment in something more fundamental: making expensive assets busier.
The Utilization Problem
Here’s the thesis the market is underpricing: Uber’s durable competitive advantage isn’t owning vehicles or employing drivers. It’s the system that keeps whatever capacity shows up—human drivers, autonomous vehicles, couriers, robots, drones—productively occupied.
The numbers prove it’s working. CEO Dara Khosrowshahi revealed that Waymo autonomous vehicles operating on Uber’s platform achieve 99th percentile utilization compared to Uber’s human drivers. That’s not a marginal difference—it’s the distinction between a vehicle productively earning 12-14 hours per day versus 6-8 hours.
Consider what that means economically. Autonomous vehicles cost $250,000 to $500,000 each. At those price points, idle time is catastrophic. A vehicle sitting unused isn’t a missed opportunity; it’s capital incineration. The company that solves utilization wins the autonomous era—regardless of who manufactures the vehicles.
The geographic evidence reinforces this. Phoenix, Austin, and Atlanta—cities where Uber has deployed the most autonomous vehicles—are growing more than twice as fast as the rest of the United States. More importantly, driver earnings per hour in Austin actually outpace the national average. Rather than cannibalizing human work, autonomous vehicles are expanding the total market by making transportation reliable and affordable during times when human supply is constrained.
Or look at the cross-platform data. Currently, only 20% of consumers in markets where Uber operates both Mobility and Delivery use both services. But those who do spend 3x more and retain 35% better than single-product users. The McDonald consolidation exists to move that 20% higher—which directly translates to more productive hours for any given vehicle or courier.
The economic logic is straightforward: higher utilization amortizes fixed costs across more productive hours, enabling lower consumer prices while maintaining or expanding absolute profit dollars. This creates a flywheel—lower prices drive more demand, more demand creates opportunities to keep capacity busy, more busy hours improve unit economics, which funds further price reduction.
This is why Q3’s trip growth came from volume, not pricing. Average pricing was down 1% YoY while trips grew 22%. Uber is deliberately choosing affordability to drive frequency—exactly what you’d do if your goal is maximizing productive hours rather than maximizing margin per transaction.
The Historical Precedent
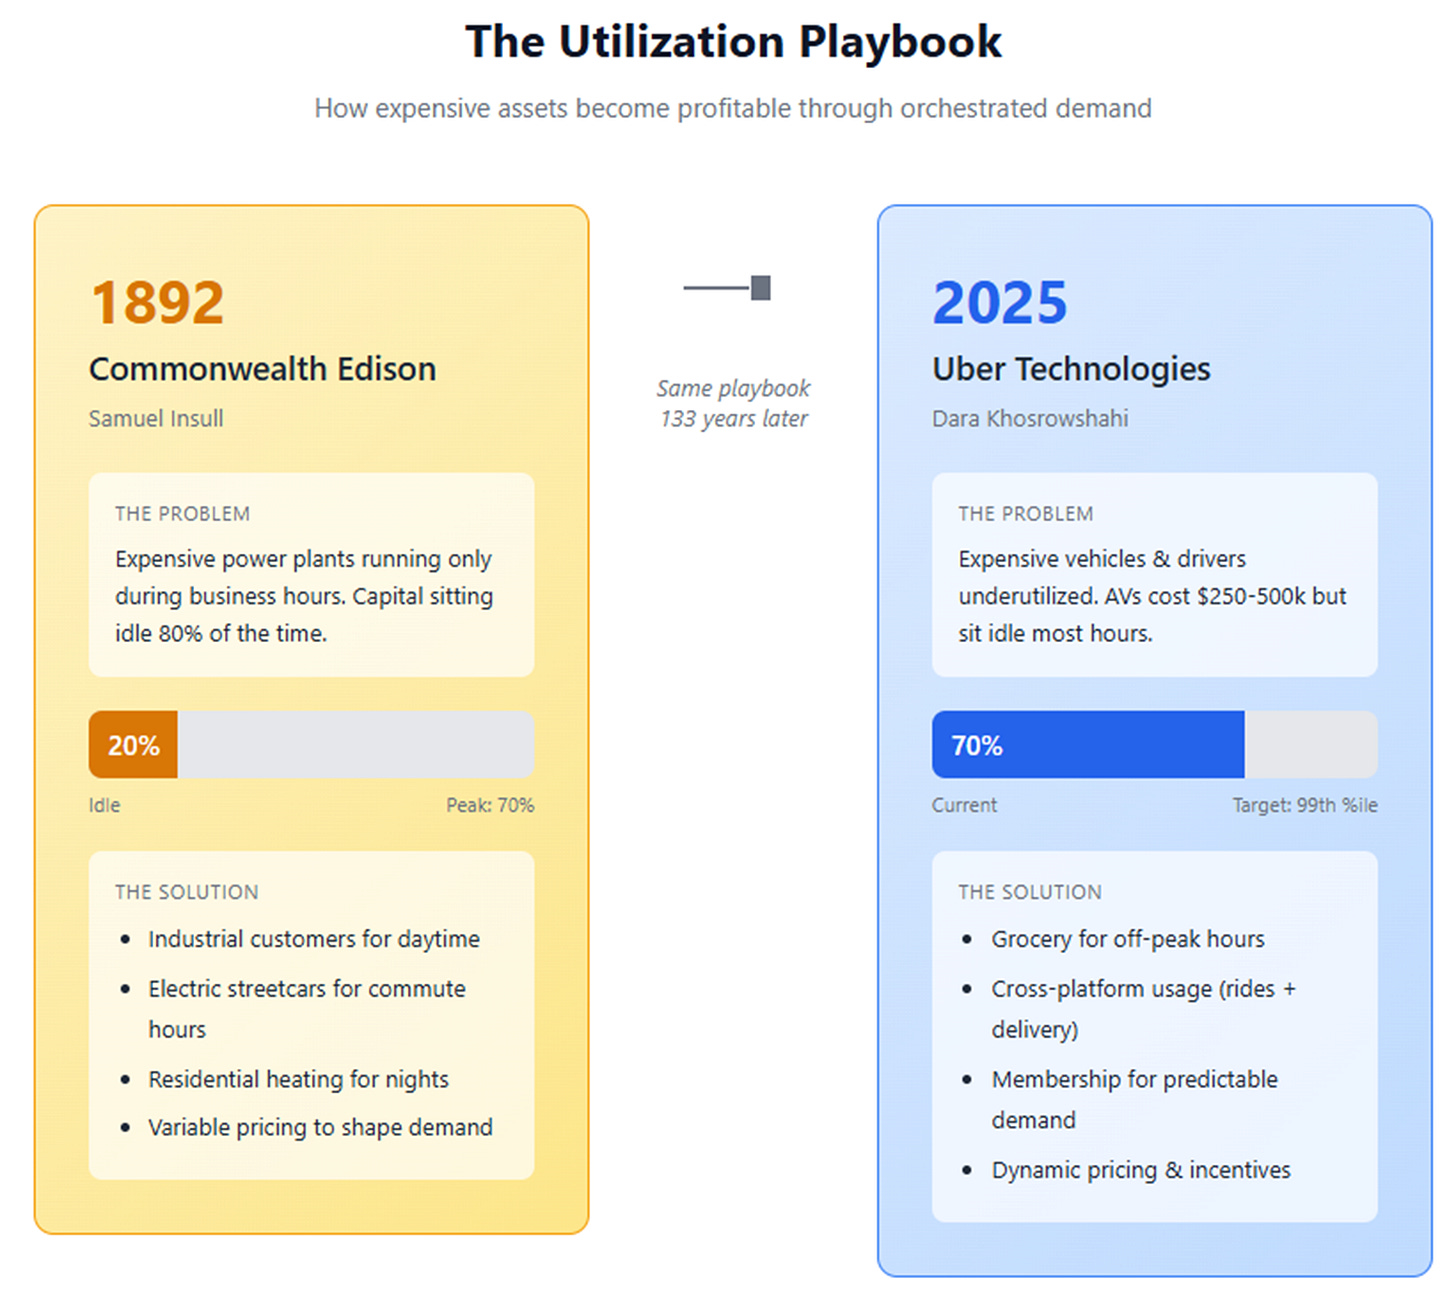
This strategy has worked before. In 1892, Samuel Insull took over Commonwealth Edison in Chicago facing an identical problem: expensive power plants that ran only 15-20% of available hours. Businesses wanted power during working hours, residences during evenings. The capital was idle most of the time.
Insull’s breakthrough wasn’t better generators or more efficient transmission. He systematically programmed demand—courting industrial customers who would use power during the day when residential demand was low, promoting electric streetcars that consumed power during commute hours, cutting rates to residential customers who used power for heating through Chicago nights. He pushed utilization from 20% toward 70%. Unit costs collapsed. Electricity transformed from luxury to utility.
Uber faces the same challenge with transportation and delivery capacity. The breakthrough isn’t better vehicles—it’s orchestrating when, where, and how people move so that expensive assets stay productively occupied.
Three Strategic Bets
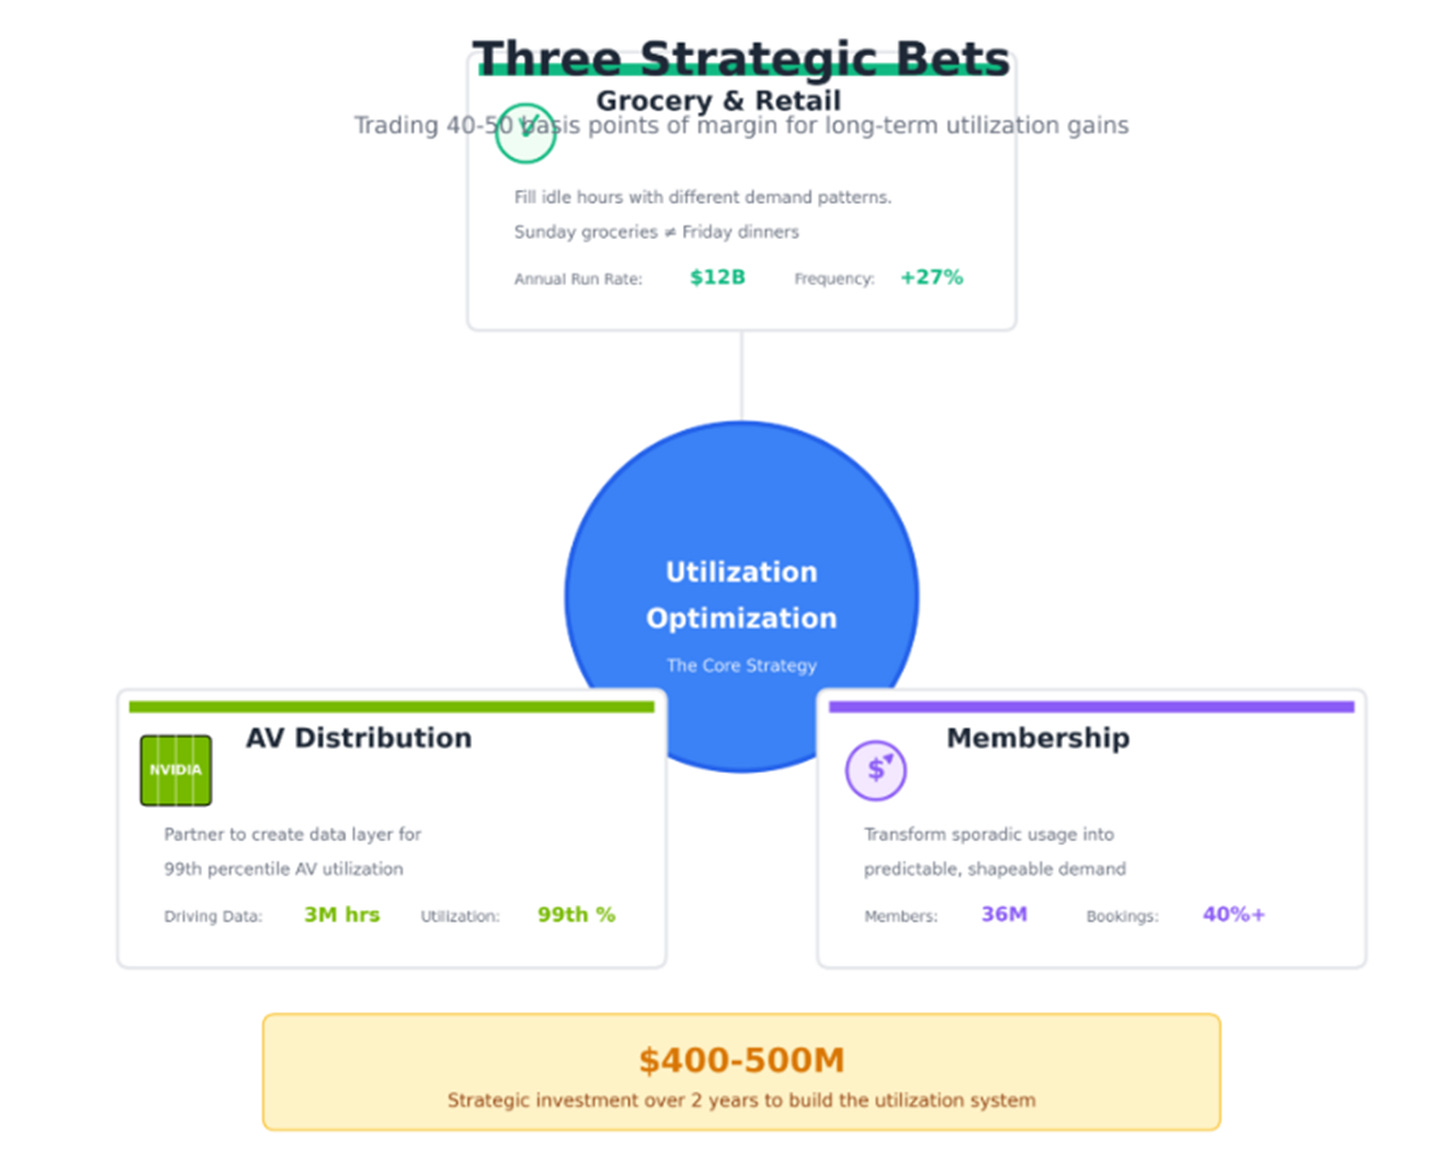
The margin “moderation” that spooked investors is the cost of building that orchestration system. Uber is trading approximately 40-50 basis points of near-term margin—roughly $400-500 million over two years—to fund three interconnected investments:
Grocery & Retail: Temporal Diversity
Uber’s grocery and retail business has reached a $12 billion annual run-rate, up from essentially nothing two years ago. It now sources 7% of new Delivery users. Most importantly, users who adopt grocery increase their total platform frequency by 27%.
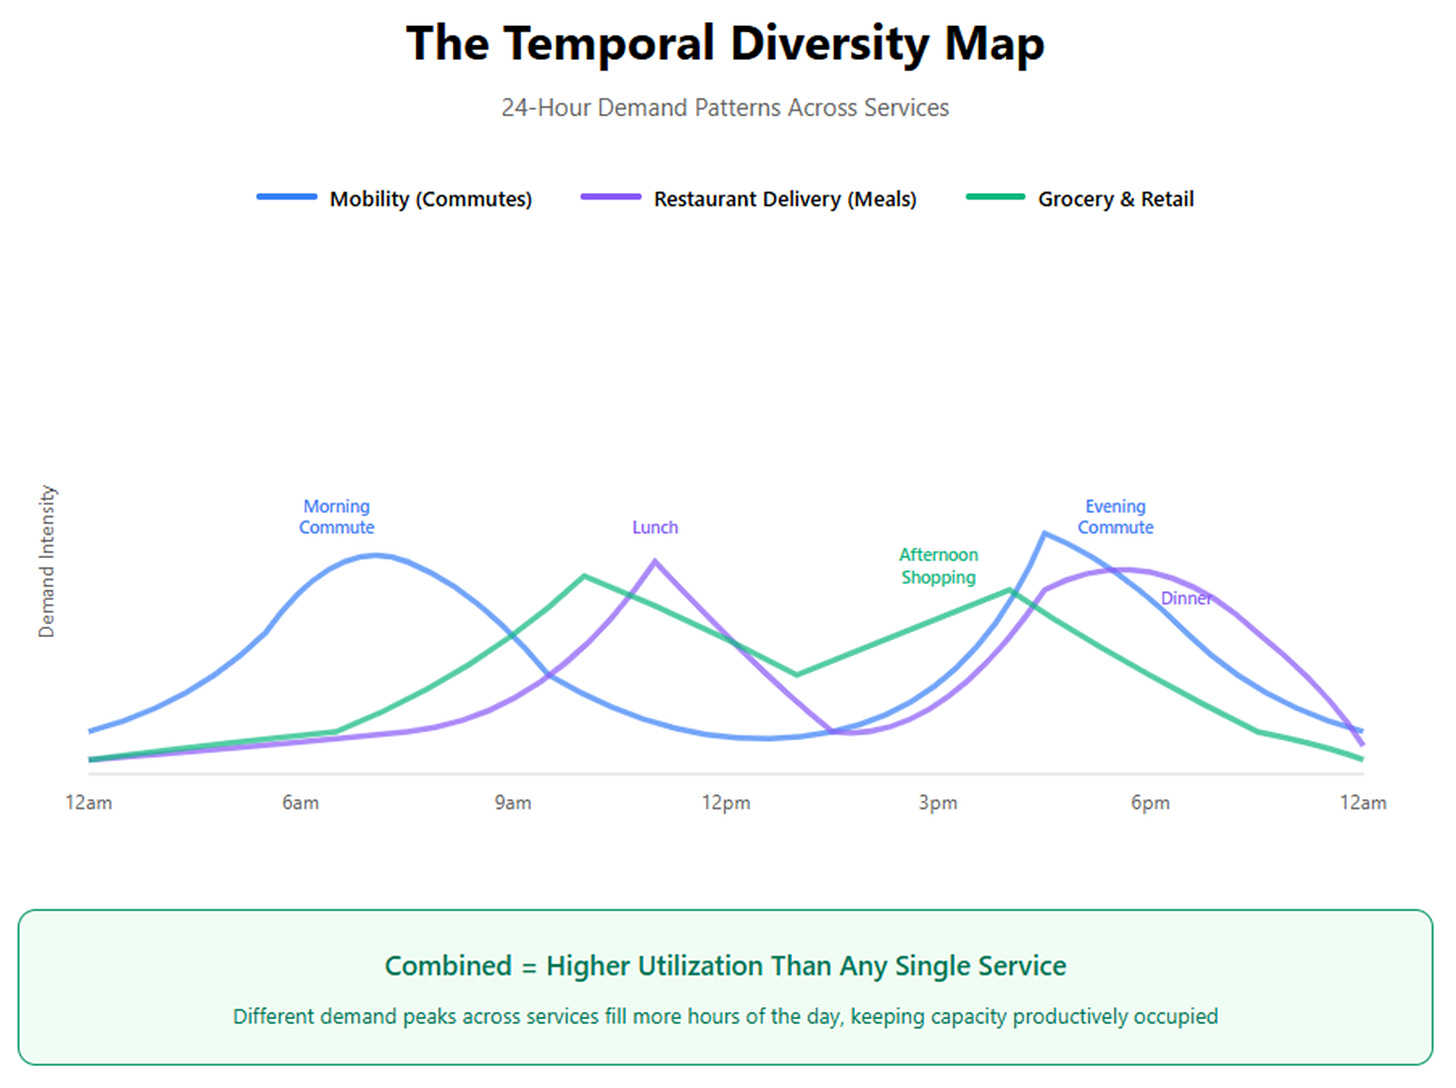
The real value isn’t the bookings or even the new users—it’s the temporal pattern. Weekly grocery shopping doesn’t happen on Friday nights when restaurant delivery peaks. It happens on Sunday mornings or Wednesday afternoons. This is Insull’s industrial/residential/transit split applied to modern delivery: different use cases create different demand peaks, and the combination raises overall utilization.
The partnerships announced around Q3 reinforce this strategy: ALDI joining with nationwide SNAP-EBT acceptance, Kroger expanding to 2,700 stores with cross-membership benefits, Toast making Uber its preferred marketplace with integrated advertising. Each expands the surface area for demand programming.
Current economics are break-even to slightly negative on a segment basis. The bet is that at $25-30 billion in scale, G&R reaches 1-2% segment margins while the cross-platform frequency lift more than justifies the investment.
Autonomous Distribution: The NVIDIA Partnership
Rather than building proprietary autonomous vehicles or betting exclusively on one technology, Uber and NVIDIA are creating a reference architecture—the NVIDIA DRIVE Hyperion 10 platform—that any OEM can use to build Level 4 autonomous vehicles. Stellantis committed to at least 5,000 vehicles initially, scaling to 100,000.
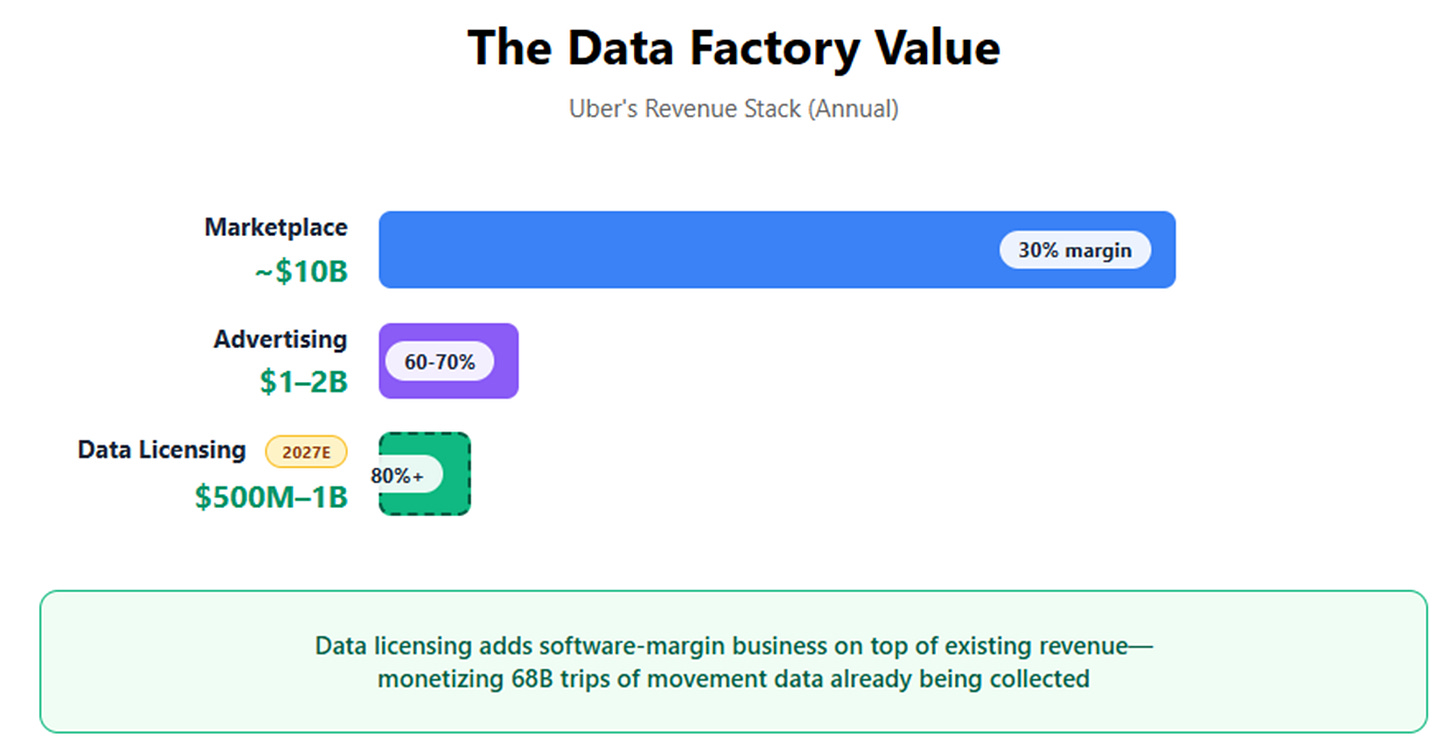
But the partnership includes something more valuable: a joint “data factory” powered by NVIDIA’s Cosmos platform. Uber will contribute over 3 million hours of real-world robotaxi driving data—the accumulated learning from 68 billion trips about how cities move, where demand materializes, when surge occurs, which routes work.
This data could become a standalone business. Every OEM and autonomous technology company needs movement patterns to train effective systems, and Uber is uniquely positioned to provide it. The potential revenue from licensing this data could reach $500 million to $1 billion annually by 2027, at software-like gross margins of 80%+.
More strategically, it shifts the competitive dynamic. If Uber becomes the essential layer that makes autonomous vehicles economically viable—by providing both demand aggregation and the data to make the technology work—then the hardware becomes commoditized. Uber doesn’t need to own the vehicles; Uber wins by ensuring no single manufacturer or technology provider can bypass the utilization optimization that only a massive marketplace provides.
Membership: Programmable Demand
Uber One, with 36 million members generating over 40% of platform bookings, isn’t just a retention tool. It’s a demand-shaping instrument. Members who pay monthly or annually exhibit more predictable usage patterns. They’re more likely to use both Mobility and Delivery. They respond to surge-savings offers that smooth demand peaks.
Membership transforms sporadic usage into routine behavior—exactly what’s needed to program when capacity should be where. The target is reaching 100 million members by 2027 with over 50% penetration of total bookings, creating a predictable base that makes the entire system more efficient.
The Choreographer, Not the Troupe
When the market sold Uber’s stock on margin guidance, it priced the company as if Uber were the dance troupe—worried about rising costs for each performer. Uber is the choreographer. The value isn’t in executing individual trips with maximum immediate efficiency. The value is composing the system—deciding which capacity goes where, when prices flex, how to sequence different types of work, where to deploy which autonomous technology, how to shape consumer behavior through membership.
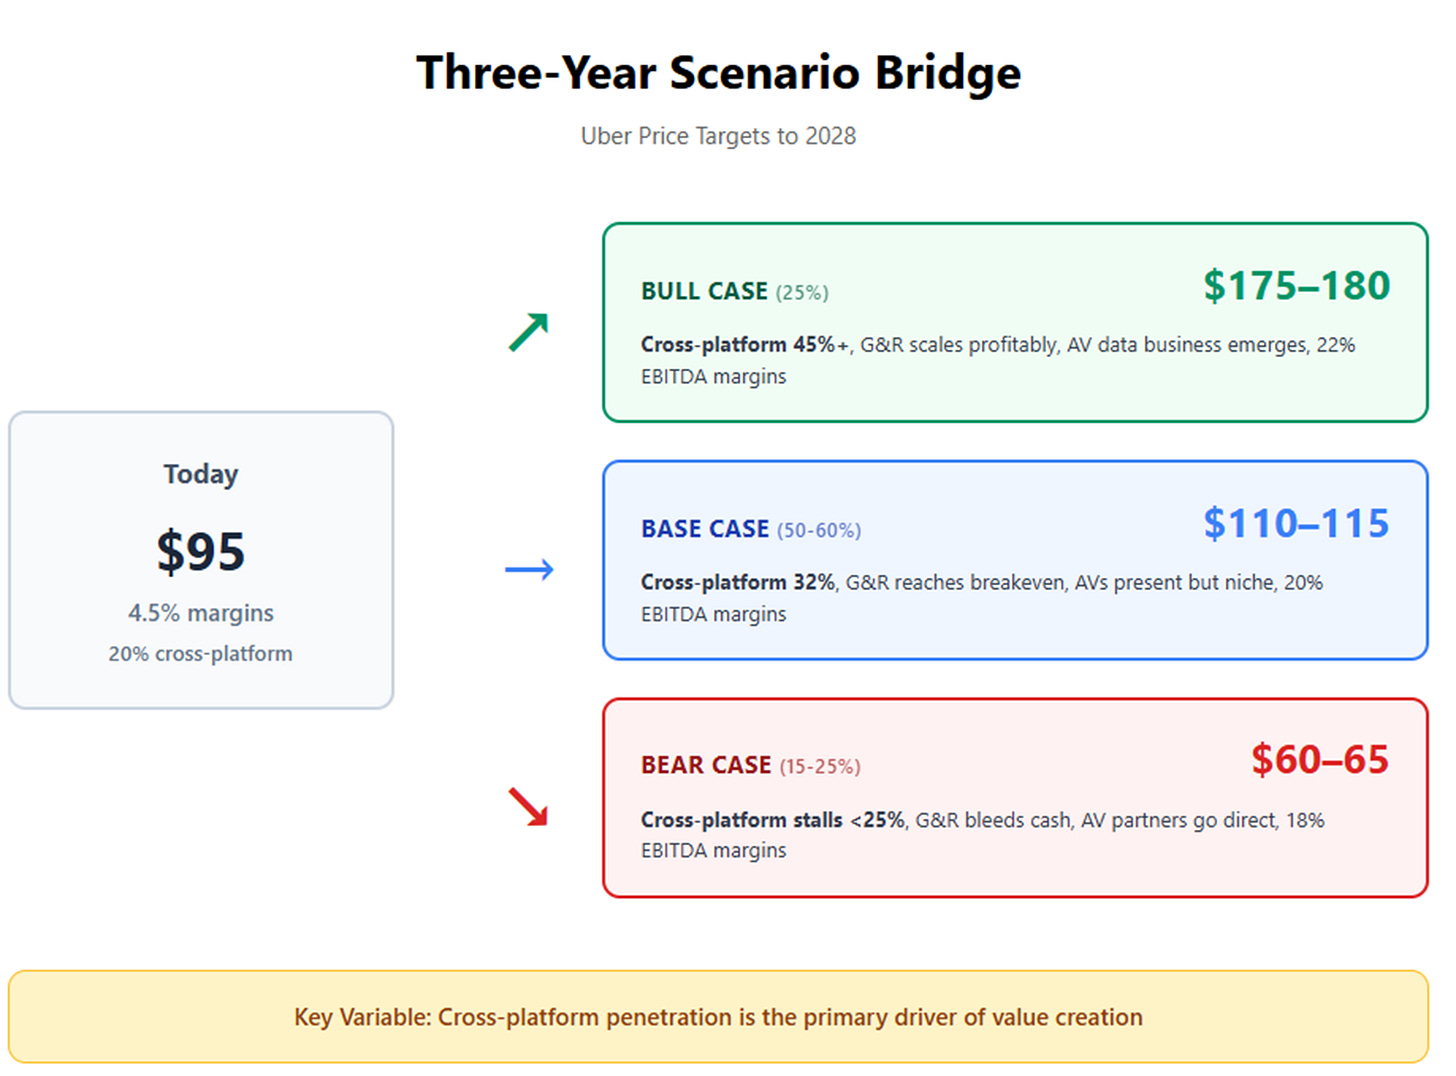
Three-Year Price Scenarios
Let me be specific about what the utilization thesis implies for Uber’s value in 2028. I’ll use enterprise value to adjusted EBITDA, with margins defined as EBITDA divided by revenue.
Bull Case (25% probability): $175-180 per share
Revenue grows at 17% CAGR through 2028, reaching $83 billion. This assumes successful G&R scaling, AV deployment across 25+ cities, and membership exceeding 45% of bookings.
EBITDA margins expand to 22% as investments mature and operating leverage kicks in, generating $18 billion in adjusted EBITDA. At an 18x EV/EBITDA multiple—reflecting confidence in durable busy-time advantages—enterprise value reaches $324 billion. With continued buybacks bringing share count to 1.86 billion: $175-180 per share.
Base Case (50-60% probability): $110-115 per share
Revenue grows at 14% CAGR, reaching $76 billion. Cross-platform usage reaches 30-32% (from 20% today), G&R approaches breakeven at scale, AVs remain niche contributors.
EBITDA margins expand to 20%, generating $15.5 billion. At 14x EV/EBITDA—roughly in line with scaled marketplaces—enterprise value is $217 billion. With 1.92 billion shares: $110-115 per share.
Bear Case (15-25% probability): $60-65 per share
Revenue grows at only 10% CAGR as cross-platform usage stalls below 25%, G&R struggles to reach profitability, and AV partners increasingly go direct.
EBITDA margins expand modestly to 18%, generating $12.5 billion on $69 billion revenue. At 10x—reflecting good economics but limited moats—enterprise value is $125 billion. With 2.04 billion shares: $60-65 per share.
The key variables are revenue growth (driven by cross-platform adoption) and margin expansion (driven by utilization improvements). The multiple reflects market confidence in the sustainability of busy-time advantages.
What to Watch
The thesis is falsifiable. Here are the metrics that will tell us whether it’s working:
· Cross-product usage: Currently 20%. If this reaches 30-35% by 2026, organizational changes are working. If it stalls at 22-25%, behavioral barriers are real.
· Uber One penetration: Currently 36 million members, 40%+ of bookings. Watch both absolute growth and percentage penetration. Higher penetration means more programmable demand.
· G&R frequency lift: Users who adopt grocery increase total platform frequency by 27%. If this persists or grows as grocery scales, it validates temporal diversity. If it fades, grocery is just low-margin volume.
· AV time-in-service: The 99th percentile utilization claim for Waymo is critical. If other AV partners show similar patterns, Uber’s demand aggregation is genuinely valuable. If they don’t, the data was cherry-picked.
· Driver economics in AV markets: In cities with significant AV deployment, human driver earnings should remain healthy. If driver earnings compress as AVs enter, the market isn’t expanding—it’s cannibalizing.
· Free cash flow conversion: Currently 107% (FCF/EBITDA). This should stay above 100% even during investment cycle. If it drops below 90%, investments are consuming more cash than expected.
What Would Prove This Wrong
Several outcomes would invalidate the thesis:
· A single autonomous vehicle provider—Tesla or Waymo—achieves sufficient city-level density that their standalone utilization equals or exceeds what Uber provides. This breaks the assumption that demand orchestration is the scarce resource.
· Grocery and retail fails to reach economic breakeven at $25-30 billion scale, and the frequency lift fades. This would suggest temporal diversity doesn’t work in practice.
· Cross-platform usage plateaus despite continued product development. This indicates behavioral barriers are real—people simply don’t want the same app for rides and food.
· Driver incentive costs rise faster than insurance savings, breaking affordability economics. If keeping human supply requires 10-15% annual cost increases while revenue per trip is flat, margins compress structurally.
Regulatory or insurance dynamics reverse, eliminating the affordability improvements Uber has been passing to consumers.
The Hours That Compound
Samuel Insull’s insight was that electric power wasn’t fundamentally about generation technology—it was about orchestrating when people used electricity. The generators were expensive either way. What mattered was how many hours per day they were productively occupied.
Uber’s third quarter suggests the company is applying the same logic to transportation and delivery. The vehicles and couriers are expensive—whether human-driven or autonomous. The scarce resource isn’t physical capacity; it’s the system that keeps that capacity busy.
The McDonald consolidation creates the organizational structure to program demand across services. Membership creates predictable, shapeable usage. Grocery adds temporal diversity that fills idle hours. The NVIDIA partnership positions Uber as the essential layer that makes autonomous vehicles economically viable.
The next 12-18 months will determine whether cross-platform usage increases, whether grocery economics work at scale, whether autonomous vehicles genuinely achieve better utilization on-platform versus off-platform. But if these pieces connect—if Uber can make its capacity busier while maintaining service quality—then the company transforms from a marketplace into something more fundamental: the operating system for urban movement.
That’s worth considerably more than the market is currently pricing. The question is execution. The hours that matter most aren’t the ones counted in quarterly reports. They’re the idle hours turned productive, the downtime converted to earnings, the wasted capacity made useful.
Three years will tell us if they’re right.
Disclaimer:
The content does not constitute any kind of investment or financial advice. Kindly reach out to your advisor for any investment-related advice. Please refer to the tab “Legal | Disclaimer” to read the complete disclaimer.


The Commonwealth Edison comparison is spot on. Uber's margin moderation makes perfect sense when you realize they're optimizing for utilization not transaction margins. The 99th percentile Waymo utilizaton stat is the key metric because it proves the platform creates value autonomous providers can't replicate alone.